Trading Tutorials - Candlestick Patterns
How to Identify a Shooting Star

Special signals might occur when a security is losing momentum.
Knowing how to identify a potential price top might help traders potentially lock in profits and take advantage of the upcoming downward price movement.
This week we’ll walk you through a common bearish reversal candlestick pattern: the shooting star.
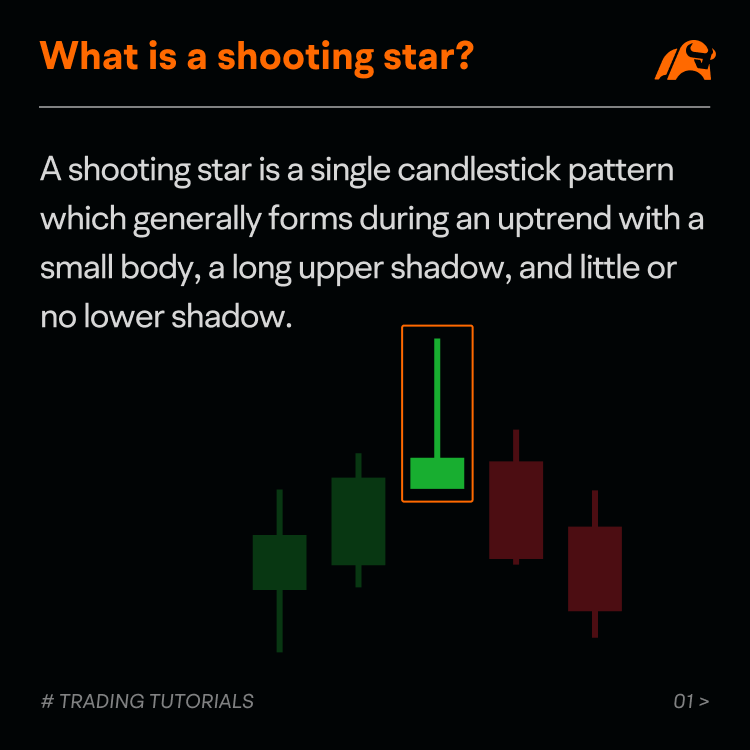
What is a shooting star?
A shooting star is a single candlestick pattern that generally forms during an uptrend and signals a potential bearish reversal.
The pattern has a small body, a long upper shadow, and little or no lower shadow. The upper shadow is typically more than twice the length of the body.
A shooting star looks very similar to an inverted hammer, another candlestick pattern that typically forms during a downtrend and signals a potential bullish reversal.
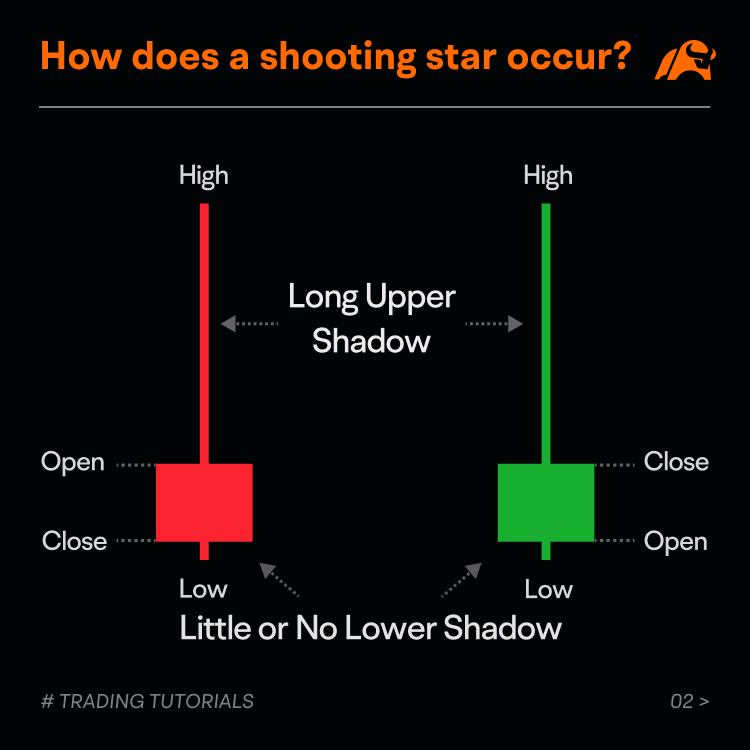
How does a shooting star occur?
A shooting star might appear at the end of an uptrend when buying pressure subsides with sellers stepping in.
On the day the pattern was formed, the price generally opens high and advances strongly during the session. The strong move could be considered a continuation of the prior bullish sentiment.
As time passes by, however, sellers step in and push the price back down to near the open, leaving a long upper shadow and a small body on the candle.
A shooting star suggests buyers are losing control of the market, and the sellers may take over later.
If the price closes well below the shooting star’s body in the next trading session, the bearish signal is likely to be confirmed, indicating a potential reversal of the prior upward move.
How to identify a shooting star?
To potentially identify a shooting star, traders might consider the following characteristics.
● Uptrend
A shooting star typically forms during an uptrend, meaning the price makes higher highs. But an inverted hammer occurs in a downtrend, so the difference between the two patterns lies in the context.
● Long upper shadow
The candle’s upper shadow should be long, indicating that buyers tried to push the price much higher, but it pulled back during the session. The upper shadow should be more than twice the length of the body, while there should be little or no lower shadow on the candle.
● Small body
A small body means the closing price does not change much from the opening price. The color of the body does not matter. In other words, a shooting star can either be a bullish or bearish candle.
● Confirmation
A bearish signal is likely to be confirmed in the next trading session if the price closes below the shooting star’s body. However, once the price breaks above the pattern’s top, the pattern fails.

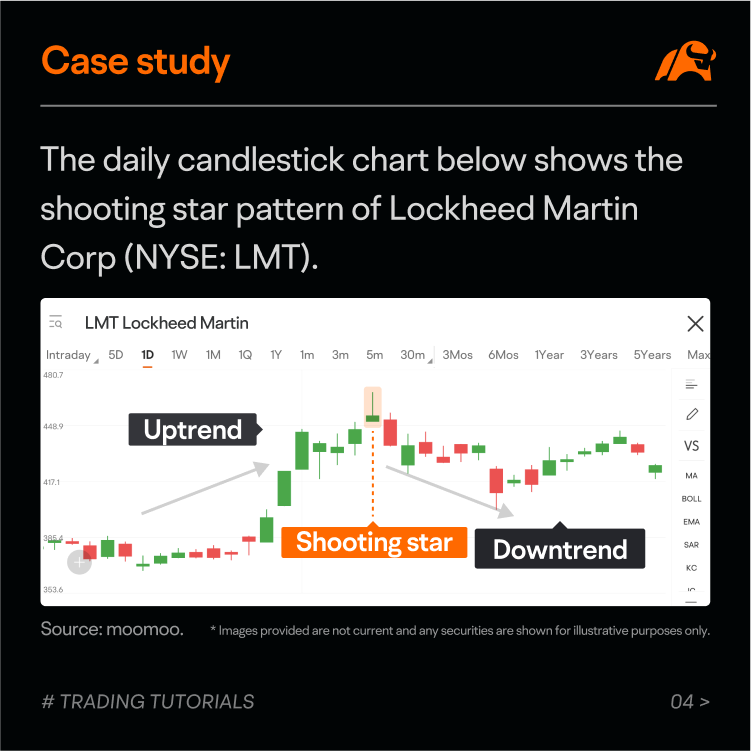
Case study
The daily candlestick chart below shows the shooting star pattern of Lockheed Martin Corp (NYSE: LMT).
The stock was in a prominent uptrend before the shooting star showed up.
On the day the shooting star was formed, the stock opened above the previous closing price.
The price moved higher during the session and hit a new high.
As the buying pressure subsided and sellers stepped in, the price retraced most of the daily gain and closed the session just higher than the opening price, forming a long upper shadow and a small body on the candle.
On the day after the shooting star, the price dropped significantly, helping to confirm a potential bearish trading bias.
Summary
The shooting star could be considered a bearish reversal candlestick pattern which generally forms during an uptrend.
The pattern might help traders with long positions identify a potential exit point or signal a potential entry point to short sellers. But the pattern may not always work.
It is worth noting that a single candlestick is only part of the story. The shooting star pattern should be used in concert with other technical indicators to make more informed trading decisions.