TXNTexas Instruments
164.5106.250+3.95%7.64M1.25B161.740158.260166.350161.080149.45B149.31B908.47M907.63M+1.87%+11.77%+1.04%-8.63%-22.25%-2.98%-10.86%3.23%0.84%31.1631.643.33%Semiconductors
FLEXFlex Ltd
36.7351.385+3.92%3.25M119.21M36.10035.35036.99035.75014.07B13.99B383.10M380.83M+4.30%+16.47%+25.29%-14.93%-5.76%+33.97%-4.31%--0.85%14.9916.113.51%Electronic Components
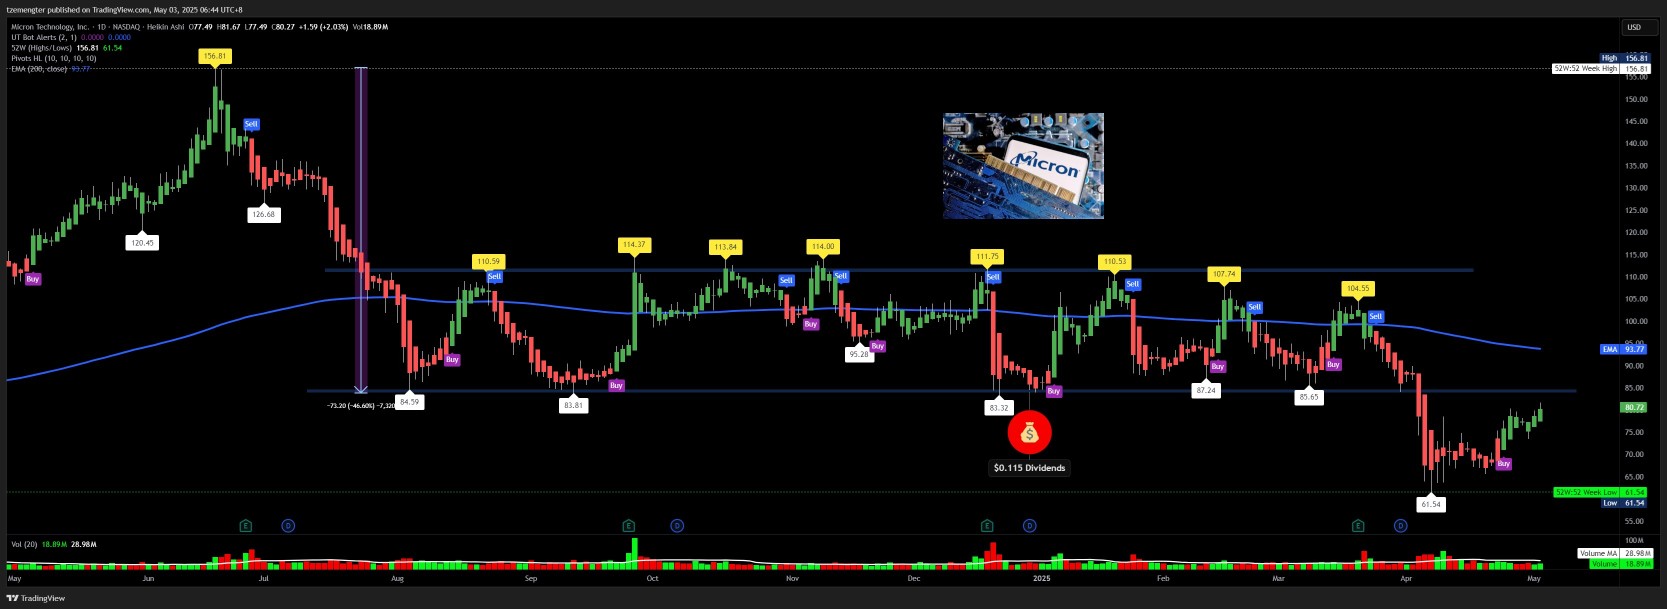
MUMicron Technology
80.7202.950+3.79%18.90M1.52B79.58577.77081.67079.10090.21B87.74B1.12B1.09B+1.18%+17.33%+8.58%-13.65%-27.63%-27.81%-3.96%0.57%1.74%19.31115.313.31%Semiconductors
AMKRAmkor Technology
18.1400.660+3.78%1.87M33.89M17.83017.48018.37017.7604.48B1.88B247.06M103.62M+3.36%+13.59%+14.48%-26.84%-32.21%-41.11%-29.09%1.78%1.80%14.1712.693.49%Semiconductor Equipment & Materials
COHRCoherent
71.6402.470+3.57%3.34M240.04M70.58069.17073.05070.50011.10B8.99B154.97M125.43M+11.09%+29.57%+32.89%-20.49%-27.95%+29.41%-24.37%--2.67%LossLoss3.69%Scientific & Technical Instruments
NXPINXP Semiconductors
188.1406.300+3.46%3.43M646.15M184.480181.840191.610184.28047.53B47.43B252.63M252.10M-2.80%+10.19%+9.46%-11.34%-17.92%-24.70%-9.04%2.16%1.36%20.4919.344.03%Semiconductors
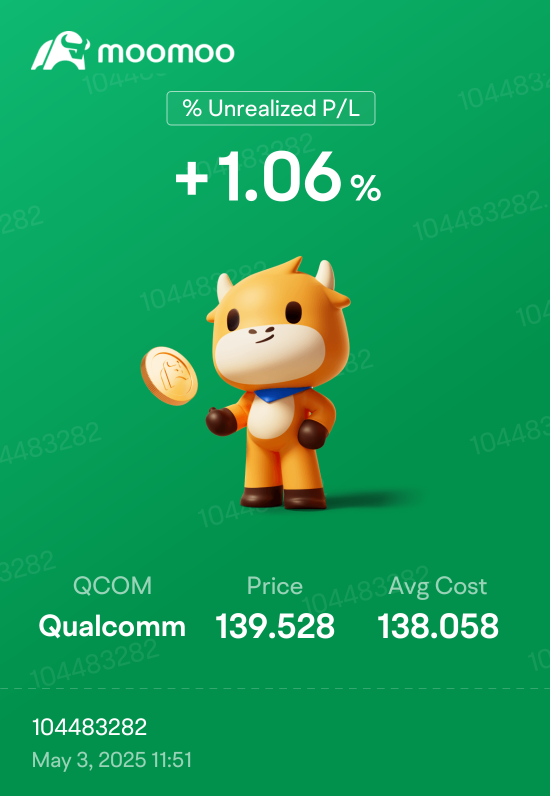
QCOMQualcomm
139.8104.600+3.40%13.19M1.84B137.850135.210141.410137.290153.51B153.20B1.10B1.10B-5.89%+2.30%+0.28%-20.07%-18.32%-20.82%-8.50%2.43%1.20%14.2415.593.05%Semiconductors
INTCIntel
20.6200.640+3.20%63.30M1.30B20.26019.98020.78020.21089.94B88.03B4.36B4.27B+2.84%+8.93%-8.07%+4.94%-17.68%-31.71%+2.84%1.21%1.48%LossLoss2.85%Semiconductors
AVGOBroadcom
203.6406.310+3.20%17.77M3.62B203.900197.330205.680201.080957.50B941.15B4.70B4.62B+5.89%+19.09%+32.23%-11.96%+14.06%+66.43%-11.90%1.07%0.38%97.44165.562.33%Semiconductors
CRUSCirrus Logic
98.2002.660+2.78%420.18K41.32M97.42095.54099.08797.4205.22B5.18B53.14M52.74M+5.13%+14.75%+10.52%-10.19%-5.68%+14.31%-1.39%--0.80%17.8520.041.75%Semiconductors
APHAmphenol
80.6602.030+2.58%7.71M619.32M79.63078.63081.00078.76097.57B96.95B1.21B1.20B+6.34%+23.98%+28.73%+16.32%+12.30%+34.53%+16.44%0.75%0.64%39.1642.012.85%Electronic Components
GLWCorning
45.7600.980+2.19%4.43M202.39M45.35044.78045.94045.06037.07B33.65B810.00M735.40M+3.58%+10.21%+8.21%-13.64%-4.02%+39.90%-3.15%2.45%0.60%88.0078.901.97%Electronic Components
JBLJabil
150.3602.780+1.88%891.11K134.32M150.750147.580152.100150.00016.14B15.59B107.35M103.66M+2.34%+11.34%+21.76%-8.06%+9.26%+30.79%+4.54%0.21%0.86%33.8613.461.42%Electronic Components
QRVOQorvo
70.9001.090+1.56%1.96M139.42M71.74069.81072.69070.5906.62B5.98B93.40M84.32M+11.16%+23.03%+16.06%-14.15%-2.69%-25.89%+1.39%--2.32%122.24122.243.01%Semiconductors
SWKSSkyworks Solutions
66.0600.830+1.27%3.67M243.37M66.05065.23066.90065.43010.15B10.09B153.57M152.75M+7.38%+18.01%+16.40%-23.34%-25.62%-23.96%-24.72%4.18%2.41%20.3317.902.25%Semiconductors