FRGTFreight Technologies
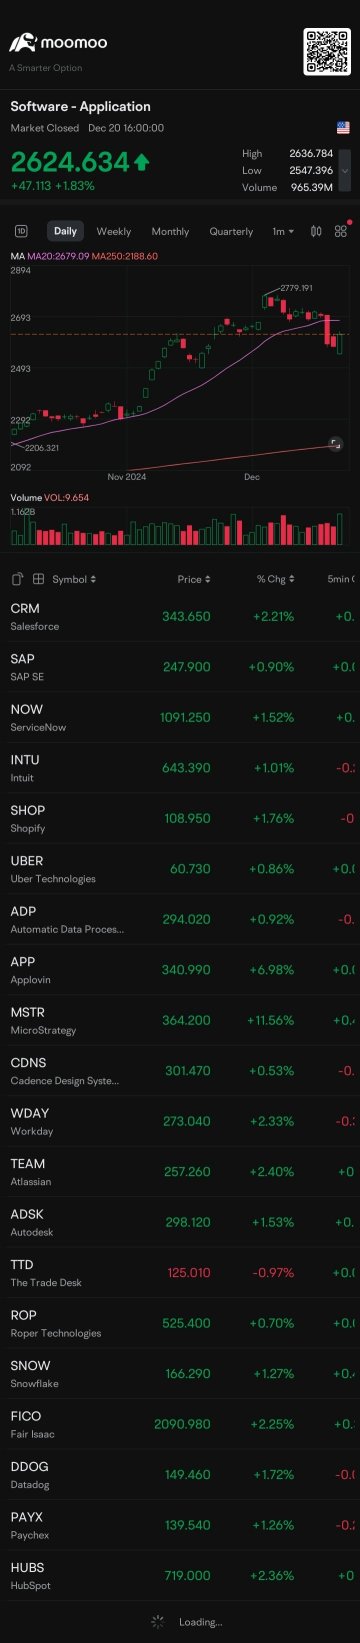
2.08001.0952+111.21%163.97M438.90M3.13000.98483.48991.93004.71M1.55M2.27M742.88K+104.24%+137.58%+89.09%+69.11%+18.18%-88.01%+10.05%--22071.69%LossLoss158.40%Software - Application
STECSantech Holdings
1.00000.2800+38.89%672.73K629.04K0.89000.72001.01000.844428.00M4.33M28.00M4.33M+6.61%-15.97%-23.66%+55.04%-4.76%+31.58%-18.70%--15.55%Loss1.6223.00%Software - Application
VSSYWVERSUS SYSTEMS INC C/WTS CL A 22/11/2027(TO PUR COM)
0.06000.0137+29.56%967.0055.000.06000.04630.06000.06000000+13.21%0.00%+30.43%-34.07%-20.00%+25.00%+33.33%--0.00%0.000.000.00%Software - Application
ATHRAether Holdings
9.6501.748+22.13%143.82K1.28M7.9607.9029.7007.960114.17M17.37M11.83M1.80M+64.96%+83.46%+124.42%+124.42%+124.42%+124.42%+124.42%--7.99%LossLoss22.02%Software - Application
DUOLDuolingo
486.42086.420+21.61%3.05M1.43B436.925400.000487.000433.00022.08B17.68B45.40M36.36M+27.39%+48.98%+54.96%+24.09%+52.55%+112.51%+50.02%--8.40%239.62258.7313.50%Software - Application
NTCLNetClass Technology
17.5002.690+18.16%546.99K8.02M14.81014.81017.50014.100312.03M87.94M17.83M5.03M+34.72%+55.69%+150.00%+100.69%+233.33%+233.33%+199.15%--10.89%LossLoss22.96%Software - Application
BULLWebull
15.9602.420+17.87%12.42M183.98M13.60013.54016.35013.1007.36B2.37B461.45M148.63M-7.59%-39.38%+39.75%+37.00%+39.02%+43.78%+37.29%--8.36%LossLoss24.00%Software - Application
SAGTSagtec Global
5.7700.770+15.40%123.59K678.07K4.7605.0006.0404.70072.41M10.10M12.55M1.75M+55.95%+150.87%+149.78%+44.25%+44.25%+44.25%+44.25%--7.06%45.0845.0826.80%Software - Application
BMRBeamr Imaging
2.7860.326+13.25%160.07K438.97K2.5012.4602.8902.45043.24M24.68M15.52M8.86M+11.44%+30.80%+21.13%-23.25%-4.91%-52.29%-43.37%--1.81%LossLoss17.89%Software - Application
ULYUrgent.ly
10.0601.100+12.28%147.67K1.46M9.0108.96010.9348.78012.52M11.06M1.24M1.10M+31.68%+119.17%+105.73%+58.30%+42.16%-52.90%+64.38%--13.43%LossLoss24.04%Software - Application
WRDWeRide
7.3500.770+11.70%14.36M103.33M6.7056.5807.4606.6502.09B1.21B284.53M164.06M+4.40%-10.69%-42.93%-46.74%-52.61%-52.58%-48.17%--8.75%LossLoss12.31%Software - Application
PETWag! Group
0.16360.0170+11.60%3.01M480.75K0.15400.14660.17330.14508.30M3.59M50.73M21.95M+25.85%+43.01%+27.71%-45.54%-72.90%-92.75%-31.35%--13.71%LossLoss19.30%Software - Application
ZENVZenvia
1.7050.165+10.71%8.41K13.66K1.6301.5401.7051.55188.43M18.97M51.87M11.12M+12.17%+33.20%-0.29%-31.25%+43.28%-13.01%-26.82%--0.08%LossLoss10.01%Software - Application
APPApplovin
307.58028.090+10.05%7.00M2.11B291.990279.490309.342286.845104.56B68.85B339.96M223.84M+11.11%+29.12%+17.41%-16.48%+82.49%+324.42%-5.02%--3.13%67.9067.908.05%Software - Application
BZAIBlaize Holdings
2.6900.230+9.35%207.89K551.11K2.4302.4602.7302.430273.53M151.84M101.68M56.45M+5.08%-2.89%+31.86%-52.60%-76.31%-75.57%-82.07%--0.37%LossLoss12.20%Software - Application
RYDERyde Group
0.24600.0210+9.33%101.21K24.52K0.22520.22500.24850.22527.21M4.40M29.29M17.90M-8.86%+13.47%-3.57%-31.95%-45.43%-93.64%-46.52%--0.57%LossLoss10.36%Software - Application
KCKingsoft Cloud
15.2301.260+9.02%3.39M51.07M14.79513.97015.42014.7953.86B1.86B253.69M122.08M+27.34%+38.02%+2.35%-2.43%+303.98%+336.39%+45.19%--2.78%LossLoss4.47%Software - Application
WCTWellchange
0.24300.0196+8.77%10.81M2.90M0.24000.22340.30680.214011.24M6.92M46.27M28.47M-0.82%-12.46%+24.62%-88.26%-96.74%-93.92%-74.69%--37.97%5.655.5241.54%Software - Application
ALTSALT5 Sigma
6.1100.485+8.62%192.37K1.14M5.7005.6256.2805.41098.24M96.51M16.08M15.80M-3.32%+18.64%+28.63%-2.71%+144.40%+55.47%+31.40%--1.22%LossLoss15.47%Software - Application
DAVEDave Inc
104.7208.290+8.60%380.56K38.83M97.88096.430104.73097.2501.40B902.56M13.34M8.62M+12.69%+24.27%+31.91%+1.04%+128.30%+138.65%+20.48%--4.42%24.9924.997.76%Software - Application
QXOQXO Inc
14.2601.040+7.87%7.96M110.69M13.35013.22014.33013.3106.38B4.77B447.17M334.71M+10.71%+8.44%+3.41%-1.11%-6.49%-84.69%-10.31%--2.38%LossLoss7.72%Software - Application
BTDRBitdeer Technologies
10.9700.790+7.76%4.39M47.86M10.33010.18011.35010.1902.16B906.33M196.75M82.62M+4.18%+43.96%+25.09%-32.49%+28.91%+94.50%-49.38%--5.32%LossLoss11.40%Software - Application
JTAIJet.AI
4.1300.290+7.55%316.93K1.28M3.9003.8404.1403.8309.03M8.90M2.19M2.16M+6.17%+6.44%+0.98%+76.50%-69.31%-97.52%-9.03%--14.70%LossLoss8.07%Software - Application
AEYEAudioEye
11.9000.820+7.40%148.07K1.73M11.12011.08012.13810.910148.25M102.86M12.46M8.64M-2.62%+5.31%+7.11%-41.29%-54.09%-31.49%-21.76%--1.71%LossLoss11.08%Software - Application
RTCBaijiayun
0.33400.0230+7.40%1.62M517.32K0.30770.31100.33900.29019.81M3.94M29.36M11.80M+2.64%-9.73%+47.92%-50.52%-95.80%-95.16%-90.75%--13.75%LossLoss15.72%Software - Application
YAASYouxin Technology
2.2750.145+6.81%33.93K78.47K2.0802.1302.4902.08076.33M9.50M33.55M4.18M-4.01%+30.00%+8.33%-39.81%-49.44%-49.44%-43.50%--0.81%LossLoss19.25%Software - Application
SGNSigning Day Sports
0.57130.0343+6.39%449.53K254.99K0.53510.53700.59990.53511.14M923.80K1.99M1.62M+2.00%+8.24%-19.54%-83.25%-94.05%-96.19%-78.28%--27.80%LossLoss12.07%Software - Application
LGCLLucas GC
0.47280.0280+6.29%168.88K80.18K0.44830.44480.51620.431237.57M709.20K79.47M1.50M+14.65%+28.98%-3.51%-12.35%-63.63%-84.60%-21.30%--11.26%6.856.8519.10%Software - Application
FMTOFemto Technologies
6.8200.400+6.23%95.43K641.82K6.3306.4207.1506.1273.82M3.81M559.90K558.02K-3.26%-28.21%-98.15%-99.61%-99.83%-99.91%-99.83%--17.10%0.000.0015.93%Software - Application
SVCOSilvaco
5.5900.310+5.87%82.81K463.25K5.3505.2805.7905.290161.02M41.53M28.80M7.43M+7.92%+27.05%+25.62%-33.69%-17.79%-70.58%-30.82%--1.12%LossLoss9.47%Software - Application