SMHISeacor Marine
4.9400.330+7.16%75.12K365.44K4.6504.6104.9904.565132.65M100.29M26.85M20.30M+0.82%+7.16%+6.93%-27.57%-31.29%-60.57%-24.70%--0.37%LossLoss9.22%Marine Shipping
CCECCapital Clean Energy Carriers
19.7501.310+7.10%71.17K1.38M17.96018.44019.86017.9601.16B211.05M58.72M10.69M+10.46%+16.16%-0.25%+4.00%+6.52%+24.78%+8.42%3.04%0.67%7.607.6010.30%Marine Shipping
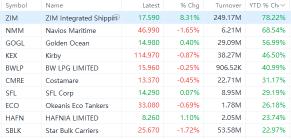
KEXKirby
104.4804.900+4.92%1.11M115.63M101.82099.580105.430100.9055.94B5.89B56.90M56.41M+7.96%+9.60%+12.47%-3.88%-17.72%-4.61%-1.25%--1.96%20.6921.284.54%Marine Shipping
BWLPBW LPG
10.5200.420+4.16%422.01K4.41M10.50010.10010.55010.3501.59B830.88M151.54M78.98M-0.28%+10.97%+2.83%-17.41%-10.34%-16.99%-3.74%31.18%0.53%3.983.981.98%Marine Shipping
GLBSGlobus Maritime
1.1100.040+3.73%11.09K12.17K1.0901.0701.1101.09022.85M15.47M20.58M13.93M-3.06%-0.45%-6.33%-18.98%-26.97%-40.64%-5.13%--0.08%55.5055.501.87%Marine Shipping
EHLDEuroholdings
5.2900.160+3.12%7.47K38.79K5.2105.1305.2945.00014.91M14.01M2.82M2.65M+9.07%+15.25%+9.07%-76.88%-76.88%-76.88%-76.88%--0.28%1.711.935.74%Marine Shipping
CTRMCastor Maritime
2.2000.060+2.80%30.18K65.80K2.1402.1402.2002.14021.26M21.23M9.66M9.65M+0.92%+2.33%+2.80%-17.11%-43.73%-29.26%-20.00%--0.31%0.851.292.80%Marine Shipping
NMMNavios Maritime
35.4200.950+2.76%71.89K2.54M35.02034.47035.64034.7501.04B531.53M29.49M15.01M+3.33%+8.72%+1.03%-19.72%-33.62%-19.28%-18.08%0.56%0.48%2.962.962.58%Marine Shipping
MATXMatson
113.1402.970+2.70%420.75K47.73M111.870110.170115.090111.5003.71B3.63B32.83M32.10M+10.51%+15.07%-1.79%-16.50%-31.54%+4.73%-15.88%1.17%1.31%8.128.123.26%Marine Shipping
DACDanaos
82.4702.110+2.63%53.99K4.43M81.50080.36082.78080.8201.54B746.42M18.67M9.05M+2.50%+7.51%+12.10%+4.41%+2.48%+11.91%+4.04%3.94%0.60%3.173.172.44%Marine Shipping
ZIMZIM Integrated Shipping
15.4100.380+2.53%3.64M56.07M15.29015.03015.65515.0101.86B1.84B120.46M119.12M+7.46%+11.75%+14.23%+3.79%-6.59%+90.60%-12.69%25.76%3.06%0.860.864.29%Marine Shipping
SHIPSeanergy Maritime
5.7400.140+2.50%60.49K347.20K5.6805.6005.8205.625119.98M82.79M20.90M14.42M+0.17%+4.94%-0.69%-13.20%-35.83%-34.63%-16.20%9.76%0.42%2.722.723.48%Marine Shipping
SBSafe Bulkers
3.4500.080+2.37%370.63K1.28M3.4103.3703.4753.380363.18M194.53M105.27M56.39M+1.77%+4.55%-1.71%-5.75%-18.56%-29.46%-2.05%5.80%0.66%4.164.162.82%Marine Shipping
GOGLGolden Ocean
7.8200.160+2.09%1.79M13.98M7.9107.6607.9507.7501.56B779.58M199.38M99.69M+0.64%+9.22%-3.22%-15.26%-27.29%-41.06%-11.10%15.35%1.79%6.986.982.61%Marine Shipping
TOROTORO CORP
1.9600.040+2.08%45.12K88.44K1.9201.9202.0301.92037.42M20.74M19.09M10.58M+0.71%+0.51%+24.08%-4.42%-10.47%-31.33%+0.68%--0.43%1.801.805.73%Marine Shipping
CMRECostamare
9.5700.180+1.92%357.07K3.41M9.6309.3909.6809.4501.15B448.90M119.96M46.91M+4.25%+7.17%+1.63%-15.40%-32.13%-19.55%-23.84%4.81%0.76%3.923.922.45%Marine Shipping
GSLGlobal Ship Lease
21.9600.410+1.90%246.66K5.41M21.86021.55022.15021.730784.77M718.73M35.74M32.73M+3.44%+6.91%+5.22%+2.77%-7.06%+1.81%+2.63%7.51%0.75%2.272.271.95%Marine Shipping
HSHPHimalaya Shipping
5.4200.100+1.88%41.52K225.23K5.4605.3205.4905.380252.30M160.22M46.55M29.56M+5.04%+18.08%+1.98%+13.37%-21.33%-31.75%+12.78%8.86%0.14%11.2911.292.07%Marine Shipping
HTCOHigh-Trend International
1.2730.023+1.84%40.52K51.65K1.2901.2501.3001.220175.04M87.38M137.50M68.64M+1.84%+15.73%+4.34%-59.59%+15.73%+46.32%-61.77%--0.06%LossLoss6.40%Marine Shipping
GNKGenco Shipping & Trading
13.5800.220+1.65%484.99K6.59M13.59013.36013.73513.445583.39M570.00M42.96M41.97M+5.85%+7.78%+7.18%-5.76%-15.31%-33.48%-0.42%11.56%1.16%7.767.762.17%Marine Shipping
SBLKStar Bulk Carriers
15.0300.230+1.55%716.71K10.76M15.00014.80015.16014.8801.76B1.41B117.13M93.55M+3.73%+8.99%+5.77%-3.33%-19.89%-32.87%+1.13%16.63%0.77%5.375.371.89%Marine Shipping
SFLSFL Corp
8.2800.120+1.47%839.30K6.91M8.2908.1608.3358.0901.11B893.79M133.97M107.95M+2.35%+6.15%+7.12%-22.40%-15.88%-32.66%-16.33%12.92%0.78%8.208.203.00%Marine Shipping
PANLPangaea Logistics Solutions
4.1700.060+1.46%210.95K875.57K4.1304.1104.2004.070273.67M137.04M65.63M32.86M-1.18%-2.11%-4.58%-19.32%-34.82%-39.57%-20.67%9.59%0.64%6.626.623.16%Marine Shipping
CISSC3is
3.8700.050+1.31%24.58K96.94K3.8303.8203.9373.7103.02M2.49M780.77K642.23K-0.77%+15.52%+11.69%-46.25%-77.37%-80.31%-54.74%--3.83%LossLoss5.93%Marine Shipping
HAFNHafnia
4.7200.060+1.29%1.34M6.33M4.7304.6604.7504.6602.35B1.12B497.99M236.82M+5.12%+11.06%+17.12%-13.13%-7.01%-28.53%-14.69%29.05%0.57%3.153.151.93%Marine Shipping
ASCArdmore Shipping
9.8100.110+1.13%390.10K3.82M9.8209.7009.8809.640397.34M351.45M40.50M35.83M+2.40%+6.40%+8.40%-16.49%-23.89%-39.78%-18.55%11.01%1.09%3.213.212.47%Marine Shipping
ECOOkeanis Eco Tankers
23.9800.250+1.05%131.69K3.13M23.68023.73024.02023.440772.01M322.19M32.19M13.44M+4.03%+11.43%+15.18%-4.70%-2.17%-14.42%+14.70%13.80%0.98%7.097.092.44%Marine Shipping
EDRYEuroDry
8.8300.080+0.91%2.63K23.18K8.7808.7508.8508.75424.96M11.46M2.83M1.30M+0.57%-3.50%-11.70%-15.90%-44.88%-56.64%-21.16%--0.20%LossLoss1.10%Marine Shipping
HMRHeidmar Maritime Holdings
2.6800.020+0.75%189.48K493.02K2.6202.6602.6802.530153.03M82.72M57.10M30.86M-3.25%-10.67%-5.30%-35.73%-96.58%-96.16%-84.16%--0.61%LossLoss5.64%Marine Shipping
ESEAEuroseas
32.3400.230+0.72%12.09K392.91K32.50032.11033.00032.240227.92M92.12M7.05M2.85M+3.89%+10.00%+9.33%+25.76%-0.88%+20.59%+12.08%7.42%0.42%2.002.002.37%Marine Shipping