What is Break-Even Point? How to Calculate in Options Trading
One important concept option traders should learn is the break-even point, which determines when a trade will no longer result in a loss. In this article, we’ll break down what the break-even point is, how to calculate it for options, and why it's crucial for traders. We'll also cover how to find the break-even point on moomoo.
What is the break-even point
The break-even point in options trading is the price level at which the buyer of an option neither makes a profit nor incurs a loss. In other words, it's the price at which the total cost of the trade, including the premium paid, is recovered. This point varies for call and put options, as each has a different calculation method (more on this later). Understanding the break-even point is essential for assessing risk and planning your exit strategies.
How the break-even point works
The break-even point serves as a benchmark for options traders, helping them determine whether their trade will be profitable or result in a loss. It is calculated based on the strike price of the option, the premium paid, and the type of option (call or put). When the price of the underlying asset reaches or exceeds this point, the trader can break even or make a profit. For any long option position that expires worthless, the loss is equal to the premium paid (assuming no exercise). For trades that reach or move past the break-even point, gains begin to accumulate.
How to calculate the break-even point
Calculating the break-even point in options involves a simple formula. However, it differs for call and put options due to the nature of each. The break-even point tells traders where the cost of entering the position is fully recovered. Here's how you can calculate it.
Break-even point formula
For a call option, the break-even point is calculated by adding the premium paid to the strike price of the option.
Formula (Call Option): Break-even = Strike Price + Premium Paid
For a put option, the formula is slightly different. The break-even point is calculated by subtracting the premium from the strike price.
Formula (Put Option): Break-even = Strike Price - Premium Paid
In both cases, the premium paid is a crucial factor. It represents the cost of the option, and it must be accounted for to determine the point at which the trade becomes profitable.
Break-even point examples
Example 1: Call option
Strike Price: $50
Premium Paid: $5
Break-even Point = $50 (Strike Price) + $5 (Premium Paid) = $55
For this call option, you would need the price of the underlying asset to rise to $55 for you to break even. Any price above $55 could result in a profit.
Example 2: Put option
Strike Price: $50
Premium Paid: $4
Break-even Point = $50 (Strike Price) - $4 (Premium Paid) = $46
For this put option, the price of the underlying asset needs to fall to $46 for you to break even. Any price below $46 could result in a profit.
Break-even point for simple options strategies
The break-even point calculation varies with different options strategies. Here's how you can calculate the break-even for some common strategies.
Long call and short call
A long call involves purchasing a call option with the expectation that the underlying asset's price will rise. The break-even point for a long call strategy is the strike price plus the premium paid.
For a short call (selling a call option), the break-even point is the strike price plus the premium received.
Long call example: If you buy a call option with a strike price of $50 and a premium of $5, the break-even point is $55.
Short call example: If you sell a call option with a strike price of $50 and receive a premium of $5, the break-even point is $55.
Long put and short put
A long put involves buying a put option, anticipating a decline in the underlying asset's price. This strategy can profit when the stock price falls below the breakeven point price. The break-even point is the strike price minus the premium paid.
A short put involves selling a put option, expecting the asset’s price to stay above the strike price or rise. It can profit when the stock price stays above the breakeven point. The break-even point is the strike price minus the premium received.
Example:
Long Put: Buy a put with a $50 strike price and $4 premium → Break-even = $46. Profits grow as the stock price drops below $46.
Short Put: Sell a put with a $50 strike price and $4 premium → Break-even = $46. Profits grow as the stock price stays above $46.
Here’s the profit/loss graph for a long put (blue) and short put (red).
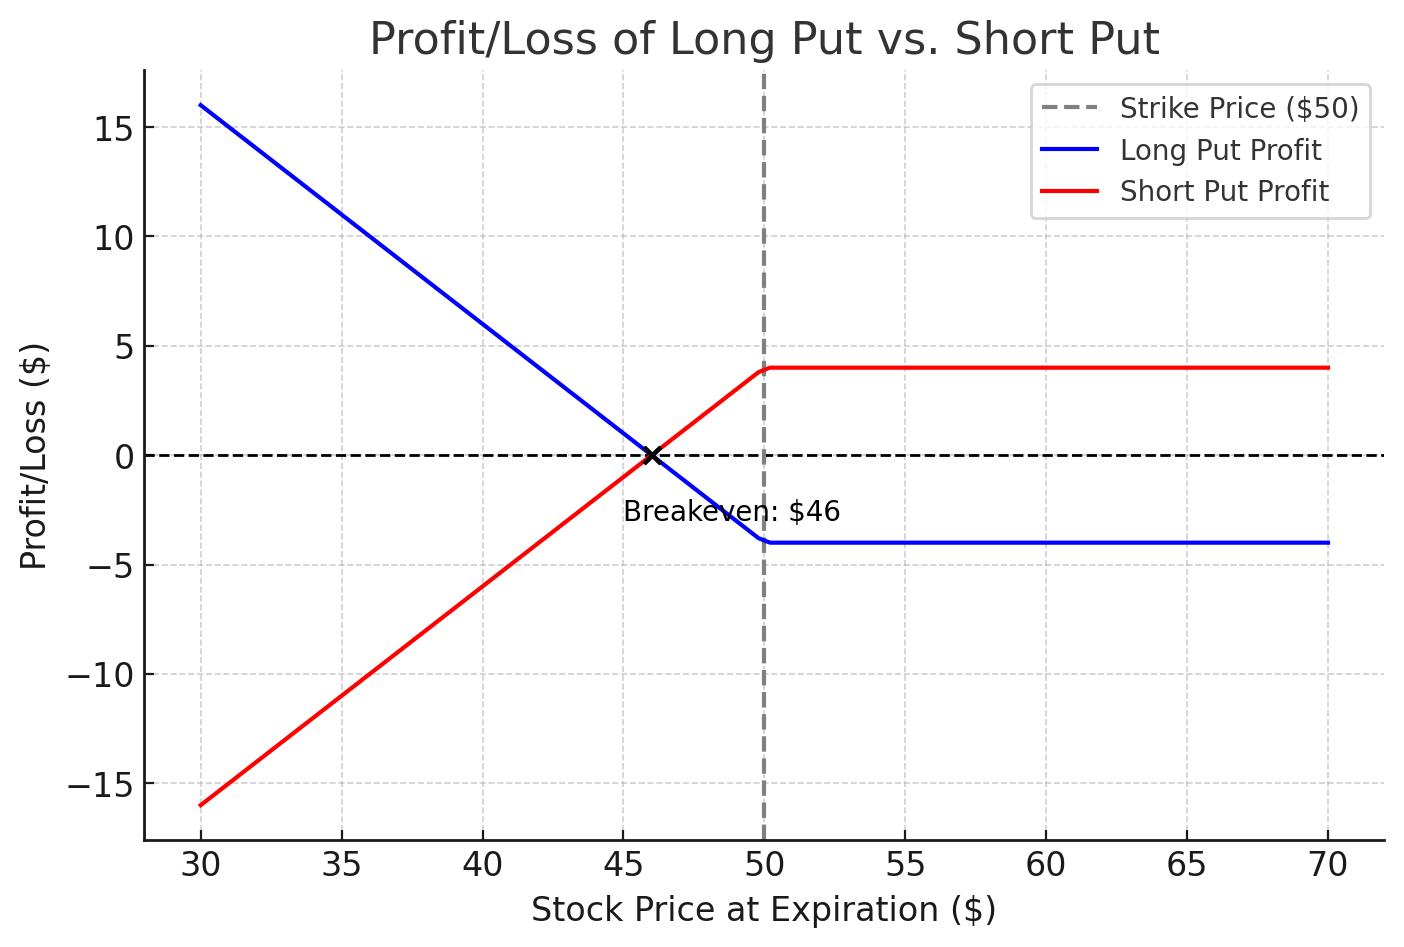
Long Put: Profits increase as the stock price drops below the breakeven point ($46).
Short Put: Profits when the stock price stays above $46 but risks significant losses if the price drops precipitously.
How to find the break-even point on moomoo
Before you start trading options on moomoo, you'll need to get approval. Your approval level determines which strategies you can use, with more advanced trades—like short puts—requiring a higher level due to their added risk. Don't worry, though — moomoo guides you through the process step by step!
Step 1: Navigate to the options trading section
Tap the "Markets" tab on the bottom navigation bar.
Search for the stock or asset you want to analyze.
Select the "Options" tab to view available options contracts.
Step 2: Choose your options contract
Browse through the list of available options.
Tap on an option contract (e.g., a call or put) you’re interested in.
Review the contract details such as strike price, expiration date, and premium.
Step 3: Open the P/L chart
Scroll down to the "Analysis" section of the selected option.
Tap the Profit/Loss (P/L) chart button to visualize the potential outcomes.
Step 4: Customize the P/L chart
Adjust parameters: Modify key factors like strike price, premium, or quantity to see how they impact projected profit and loss.
Set scenarios: Use sliders to simulate changes in the underlying asset’s price.
Break-even point: Identify where potential profit starts (strike price + premium for long calls).
Step 5: Compare strategies
Tap "Compare Strategies" to overlay multiple P/L charts, such as a long call and a long put.
This helps you understand how these strategies respond differently to market movements.
Step 6: Save or execute
Save your analysis for future reference or proceed to place a trade directly from the app.
Use the insights from the P/L chart to make more informed decisions.
Tips for using the P/L chart effectively
Look for break-even points to understand where the strategy can start being profitable.
Check the maximum profit and loss ranges to evaluate risks and rewards.
Before you actually begin trading options, first practice with moomoo's options paper trading.
Why break-even point analysis is so important
The break-even point is a vital part of options trading because it helps traders understand the minimum price at which they can recover the cost of their trade. It acts as a reference point for making trading decisions, managing risk, and setting realistic expectations for potential returns. By knowing the break-even point, traders can plan their exit strategies.
Potential benefits and risks of break-even point analysis
Potential benefits
Risk management: Knowing the break-even point helps traders assess potential risks and set stop-loss orders if needed.
Profitability analysis: It allows traders to evaluate how likely their options trades are to become profitable or incure a loss based on current market conditions.
Strategic planning: Helps traders decide when to exit a trade to lock in profits or minimize losses.
Potential risks
Incorrect calculations: Miscalculations can lead to inaccurate profitability predictions, resulting in unexpected losses.
Market volatility: Break-even analysis is based on the assumption that the stock price will move in a favorable direction. Market volatility can impact this.
FAQ about break-even point
How to calculate the break-even point in options trading?
The break-even point in options trading varies depending on the type of option. For a long call, it’s calculated by adding the premium to the strike price, while for a long put, it’s found by subtracting the premium from the strike price. These break-even levels represent the price the underlying asset must reach at expiration for the buyer to recover the premium paid. For sellers of options (short calls or puts), the same formulas apply, but the break-even indicates the price beyond which they would start incurring losses.
What is the break-even price?
The break-even price in options trading is where a trader neither profits nor loses, accounting for the premium paid or received. For a call option buyer, it’s the strike price plus the premium, while for a put option buyer, it’s the strike price minus the premium. Sellers of calls or puts break even when the premium they receive offsets losses from the asset price moving against them. For buyers of calls and puts, it’s the key price level traders use to gauge the minimum movement needed to avoid a loss.
What is a call break-even price?
The break-even price for a call option is calculated as the strike price plus the premium paid. This is the price at which the holder of the call option neither makes a profit nor incurs a loss upon expiration of the option contract. If the underlying asset’s price rises above this level at expiration, the option holder can start to make a profit, as the value of the option will exceed the premium paid. For example, if a call option has a strike price of $100 and a premium of $5, the break-even price is $105. Any price above $105 at expiration can result in a profit for the holder.
The break-even and profit/loss (P/L) calculations discussed here are based on the assumption of exercise or assignment of the option at expiration, with an immediate purchase or sale of the underlying asset at that price. This is a simplified way to evaluate the trade. During the life of the option, however, the P/L and break-even estimates are more complex and dynamic.
Options traders often close their positions before expiration, either for a profit or a loss, by selling or buying back the option contract. In these instnces, the break-even price and P/L calculations are different, as they reflect the current market price of the option rather than waiting until expiration. A P/L calculator typically shows two lines: one for the P/L at expiration and another that dynamically adjusts based on the current price of the underlying asset and the option’s time value. These dynamic estimates help traders make decisions based on real-time market conditions rather than just the expiration date.


