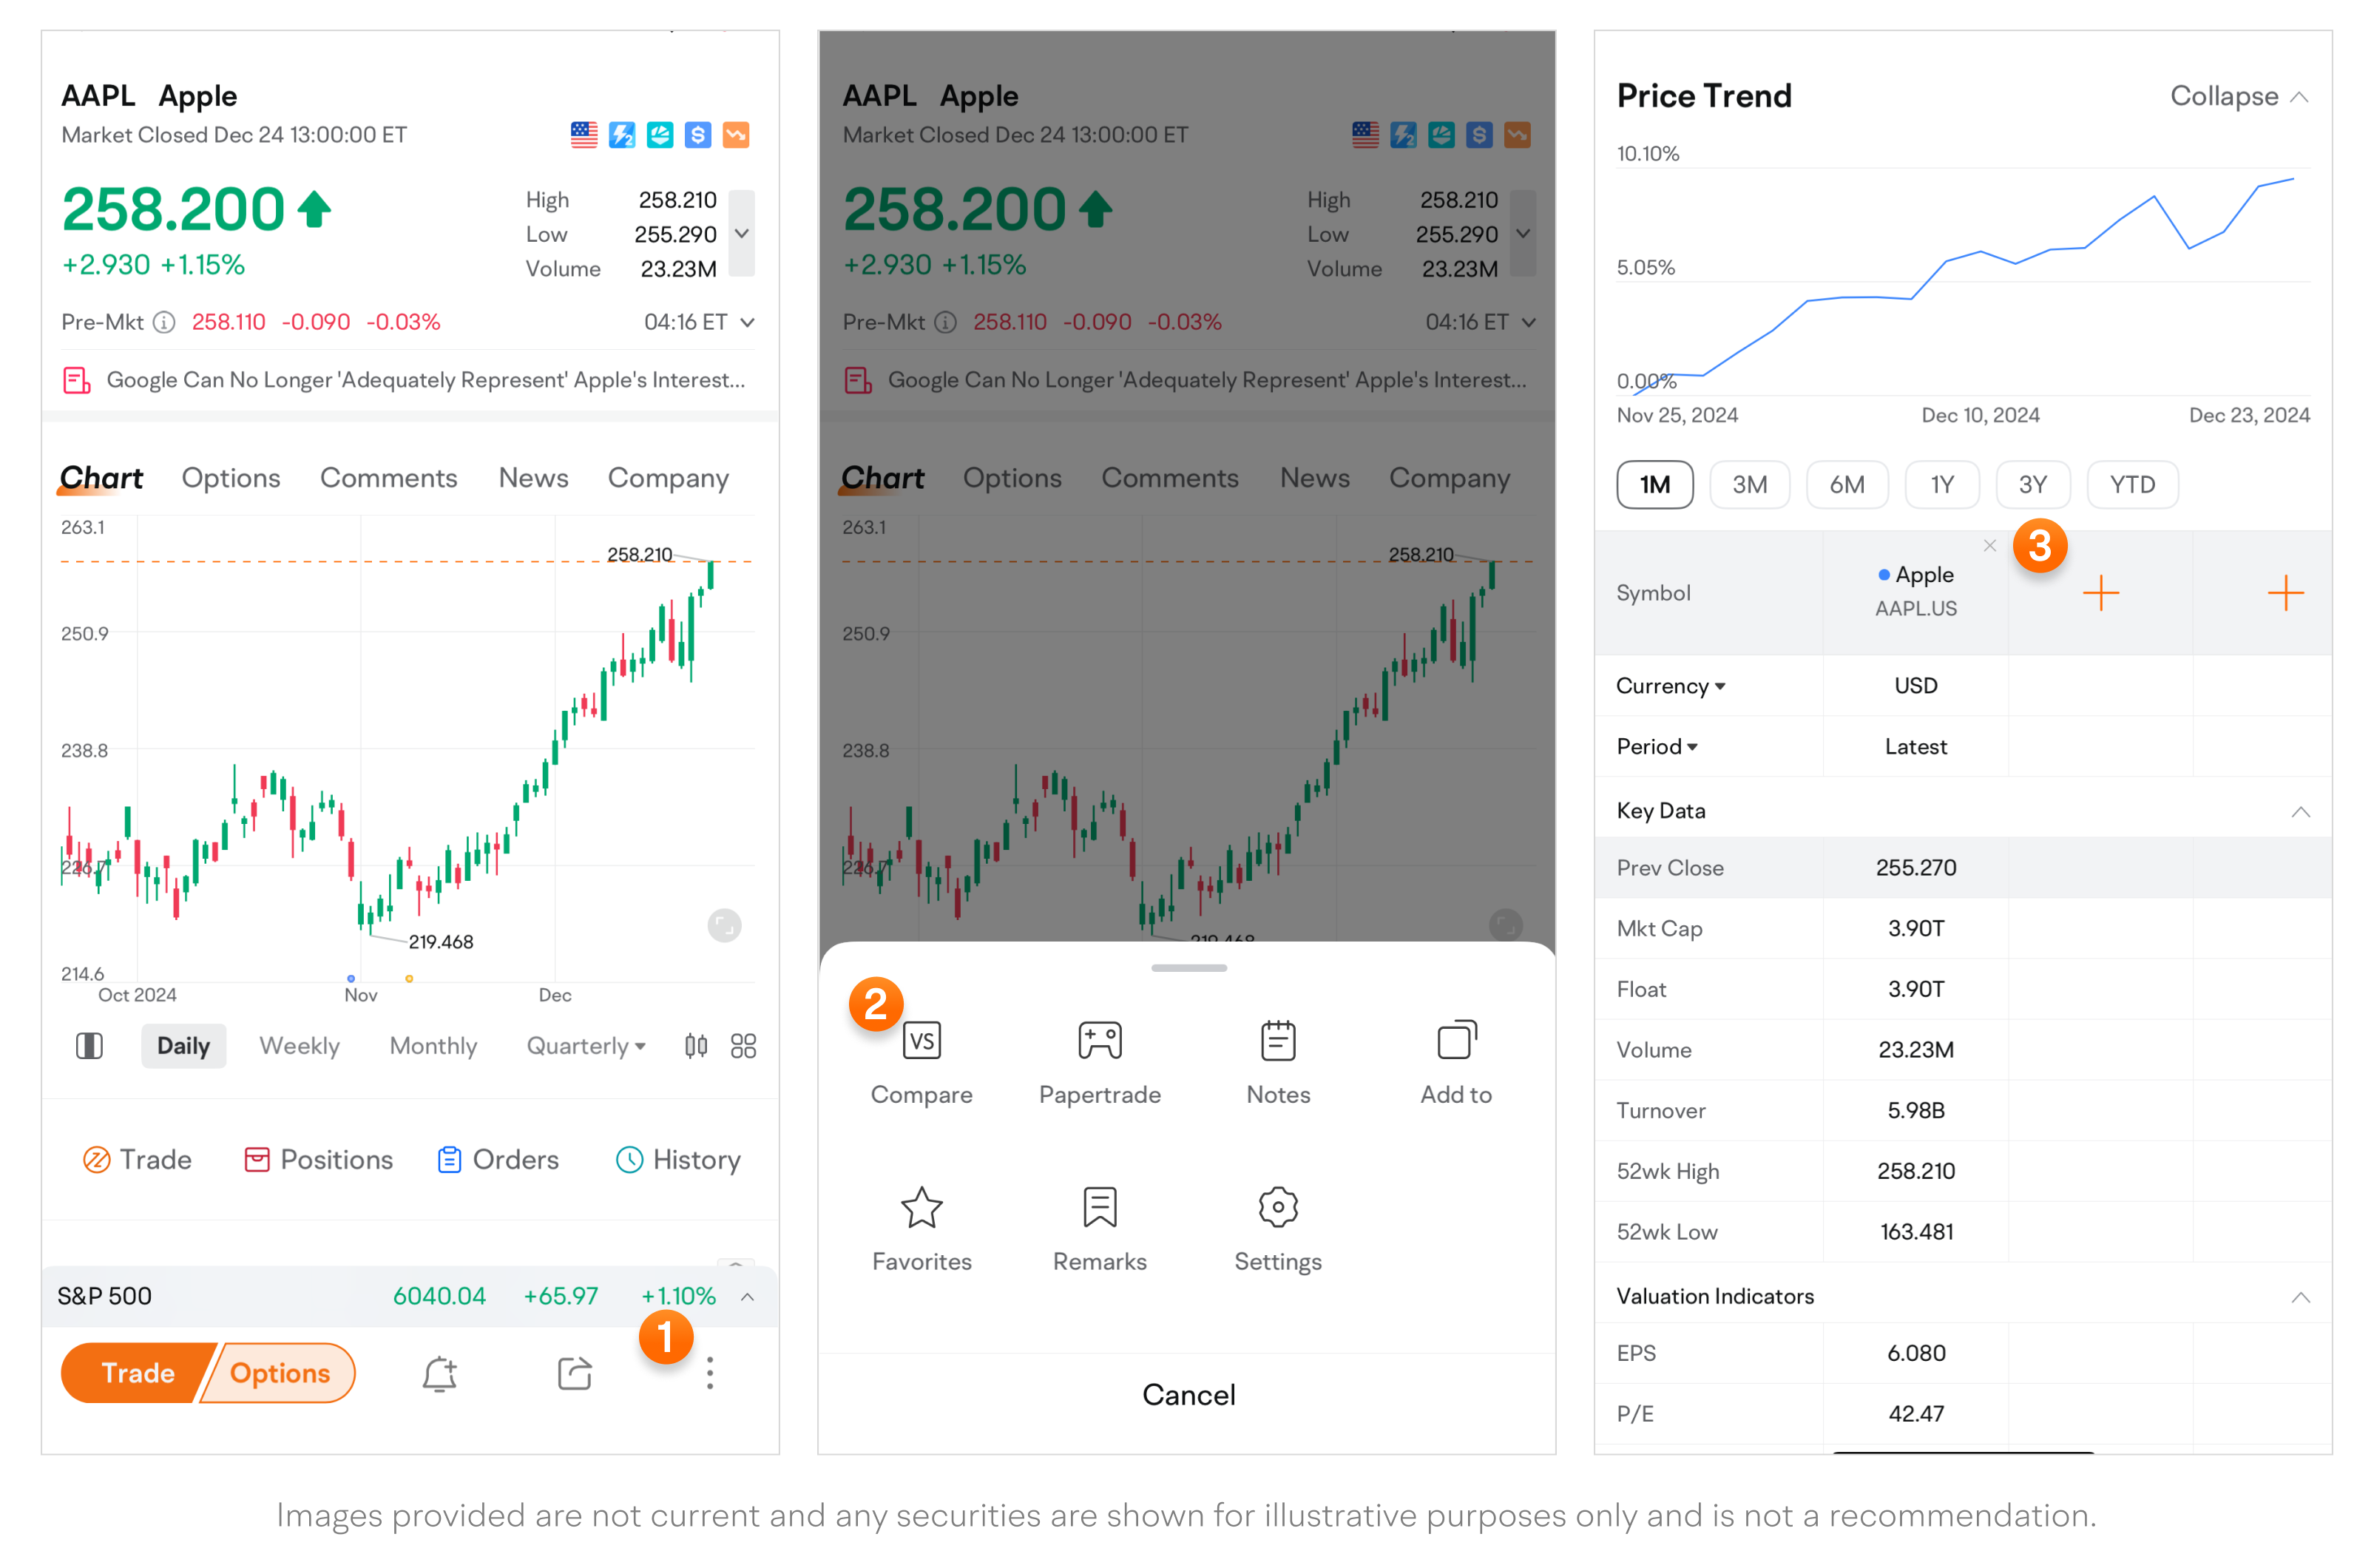
Compare
-
You can compare up to 6 stocks at a time.
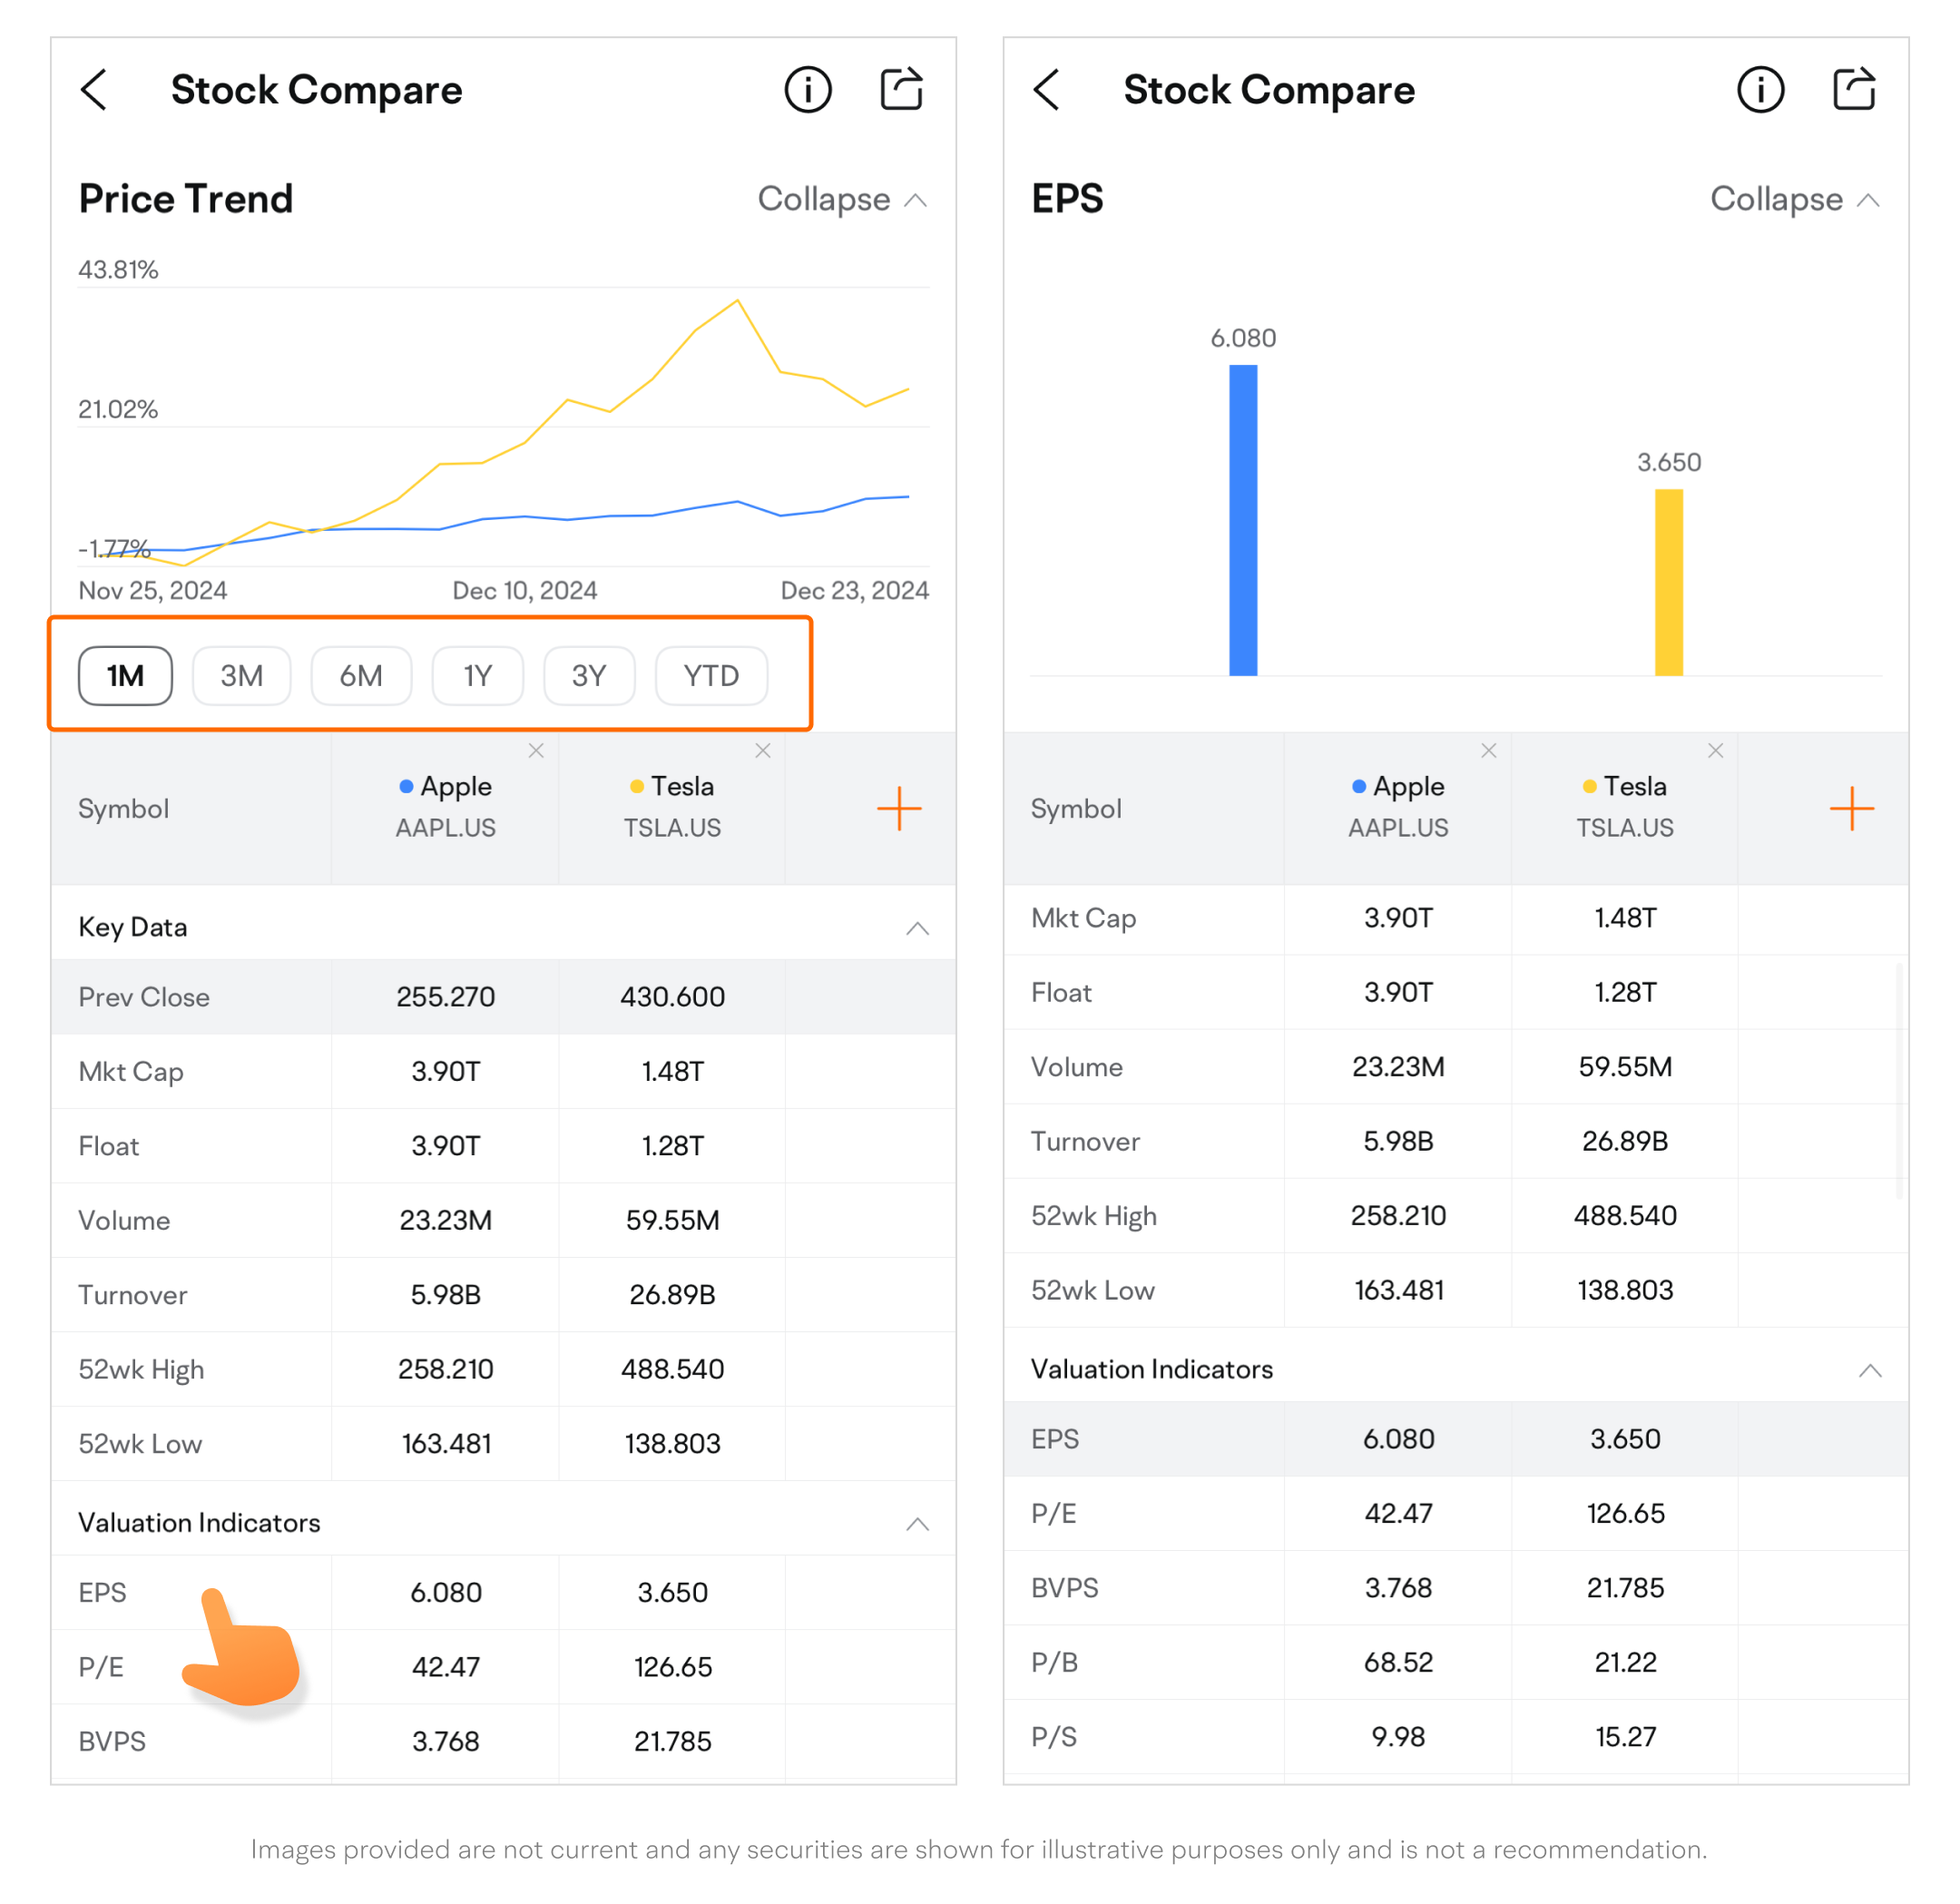
Compare price trends and other data
-
Tap the options such as 1M and YTD at the bottom of the price trend chart to switch time ranges.
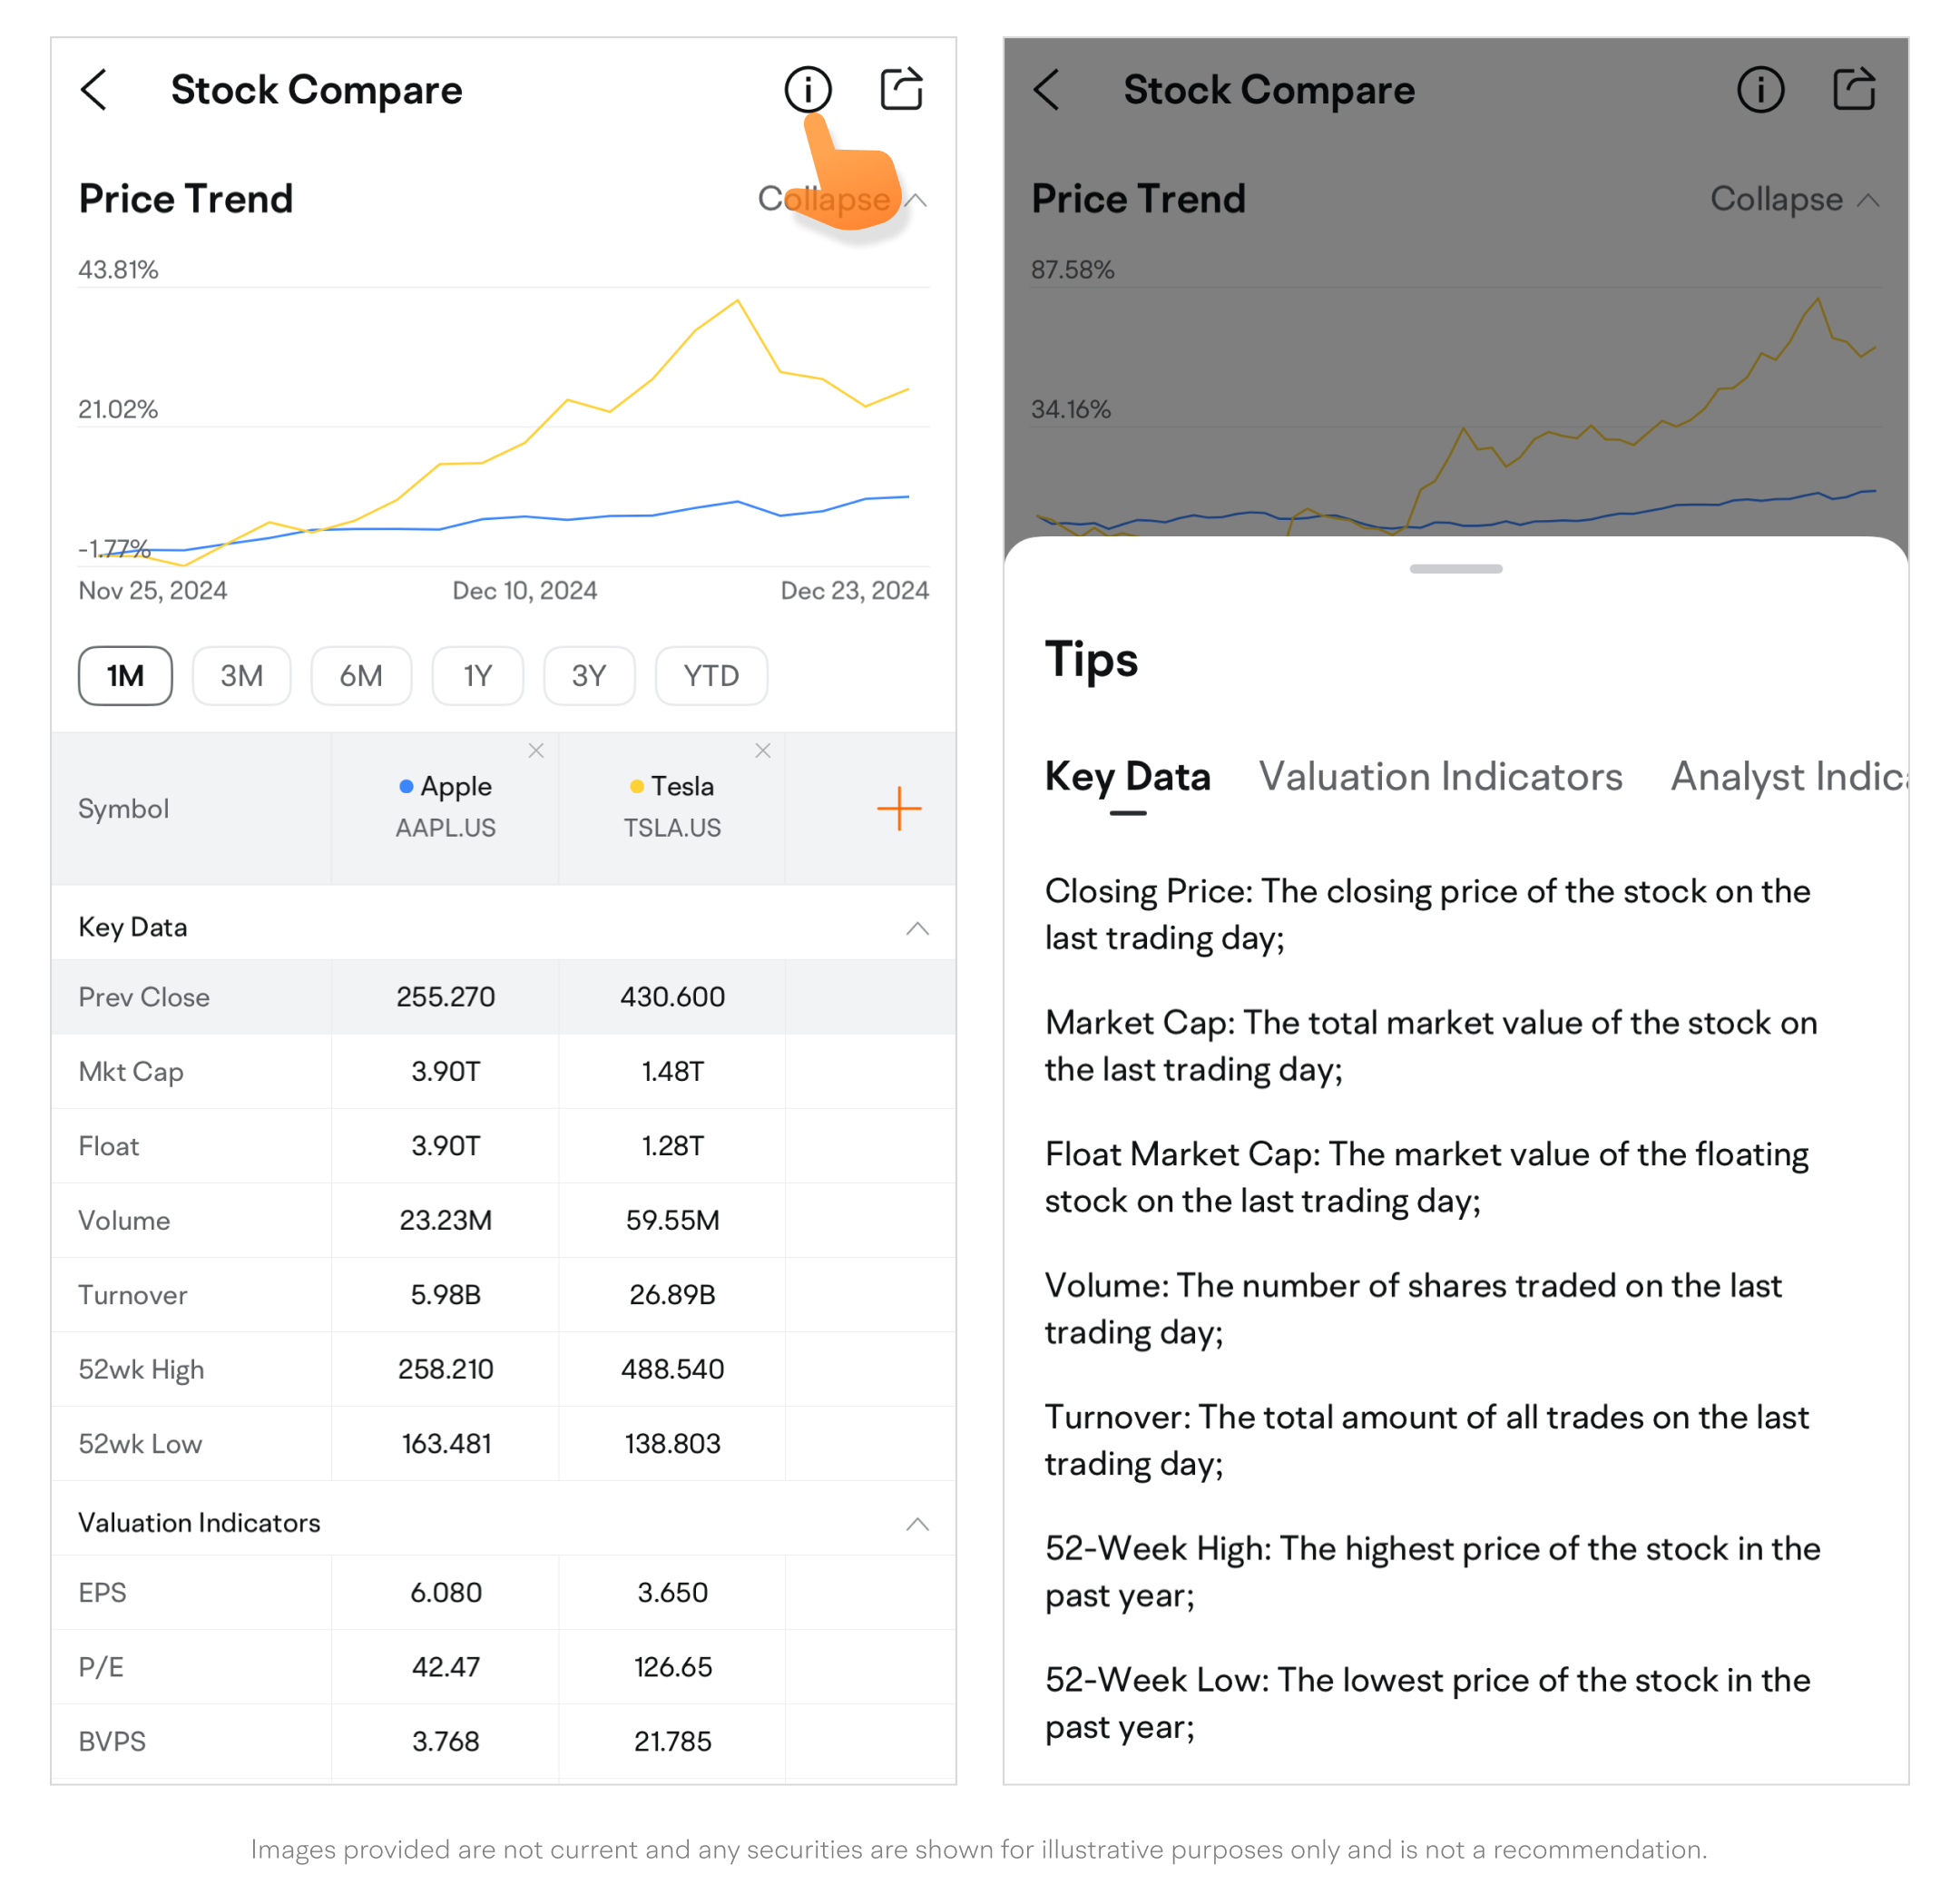
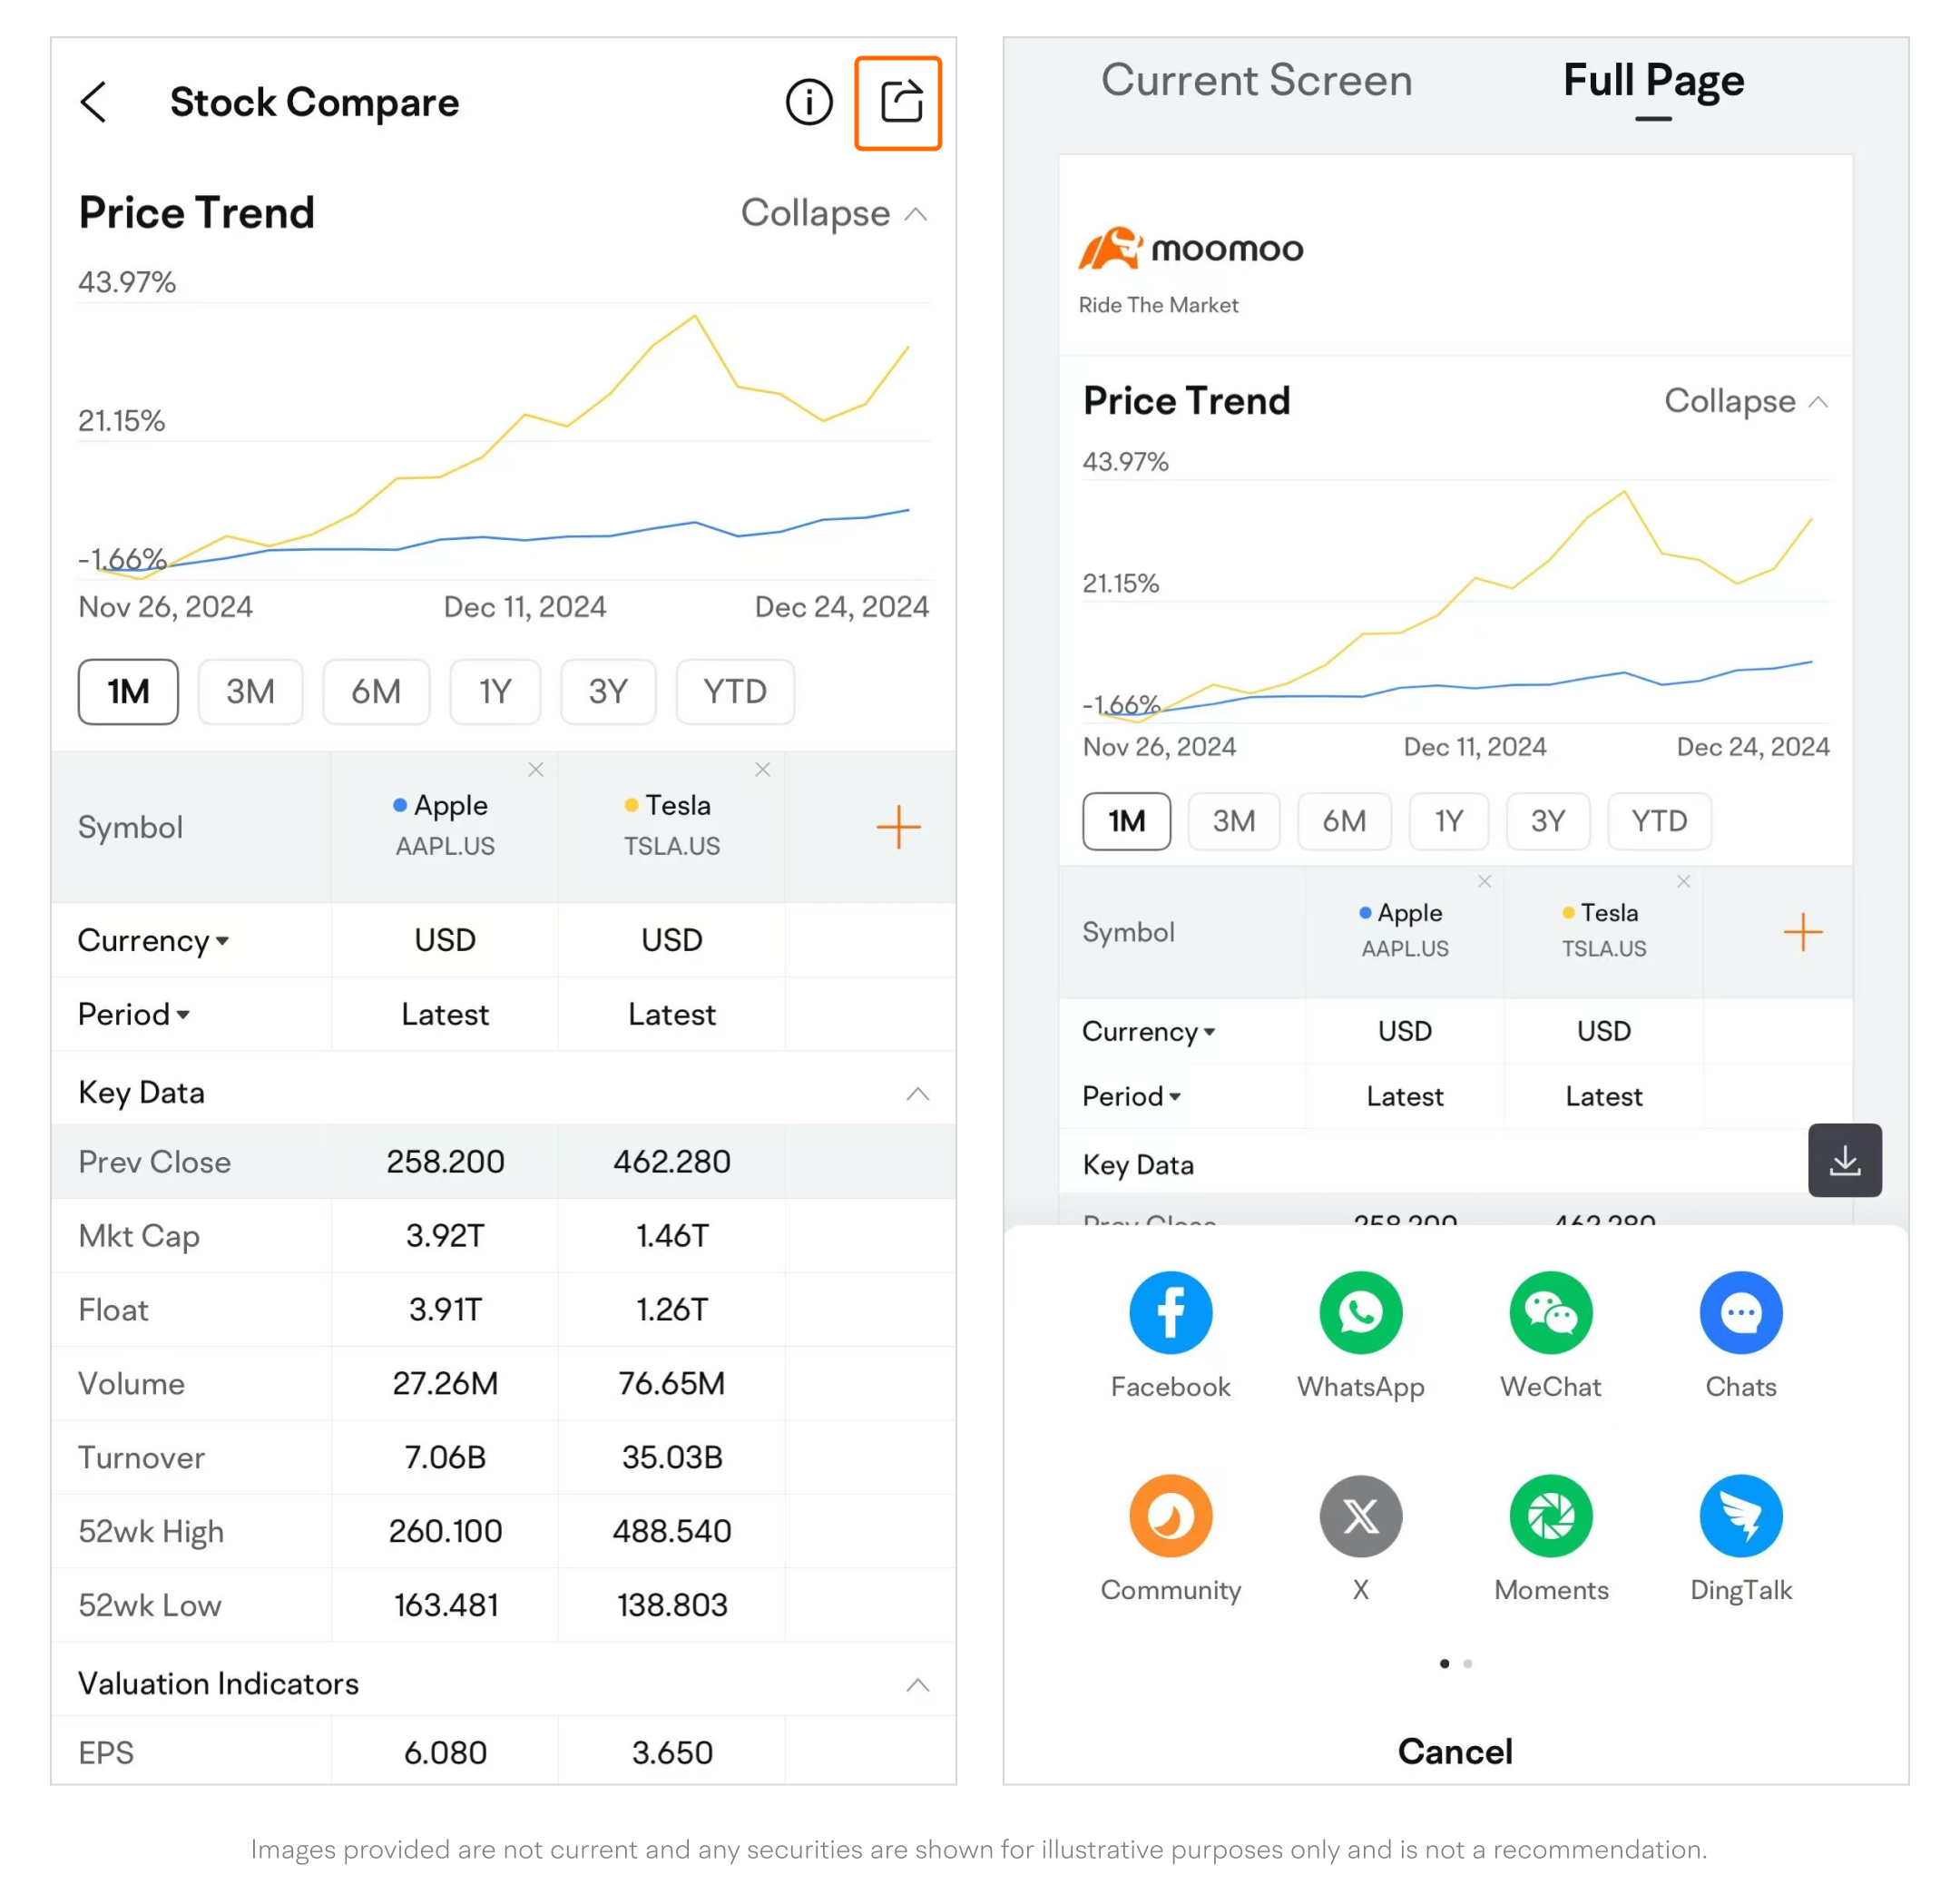
View tips and share comparison snapshot
This presentation is for informational and educational use only and is not a recommendation or endorsement of any particular investment or investment strategy. Investment information provided in this content is general in nature, strictly for illustrative purposes, and may not be appropriate for all investors. It is provided without respect to individual investors’ financial sophistication, financial situation, investment objectives, investing time horizon, or risk tolerance. You should consider the appropriateness of this information having regard to your relevant personal circumstances before making any investment decisions. Past investment performance does not indicate or guarantee future success. Returns will vary, and all investments carry risks, including loss of principal.
Moomoo is a financial information and trading app offered by Moomoo Technologies Inc. In the U.S., investment products and services on Moomoo are offered by Moomoo Financial Inc., Member FINRA/SIPC.