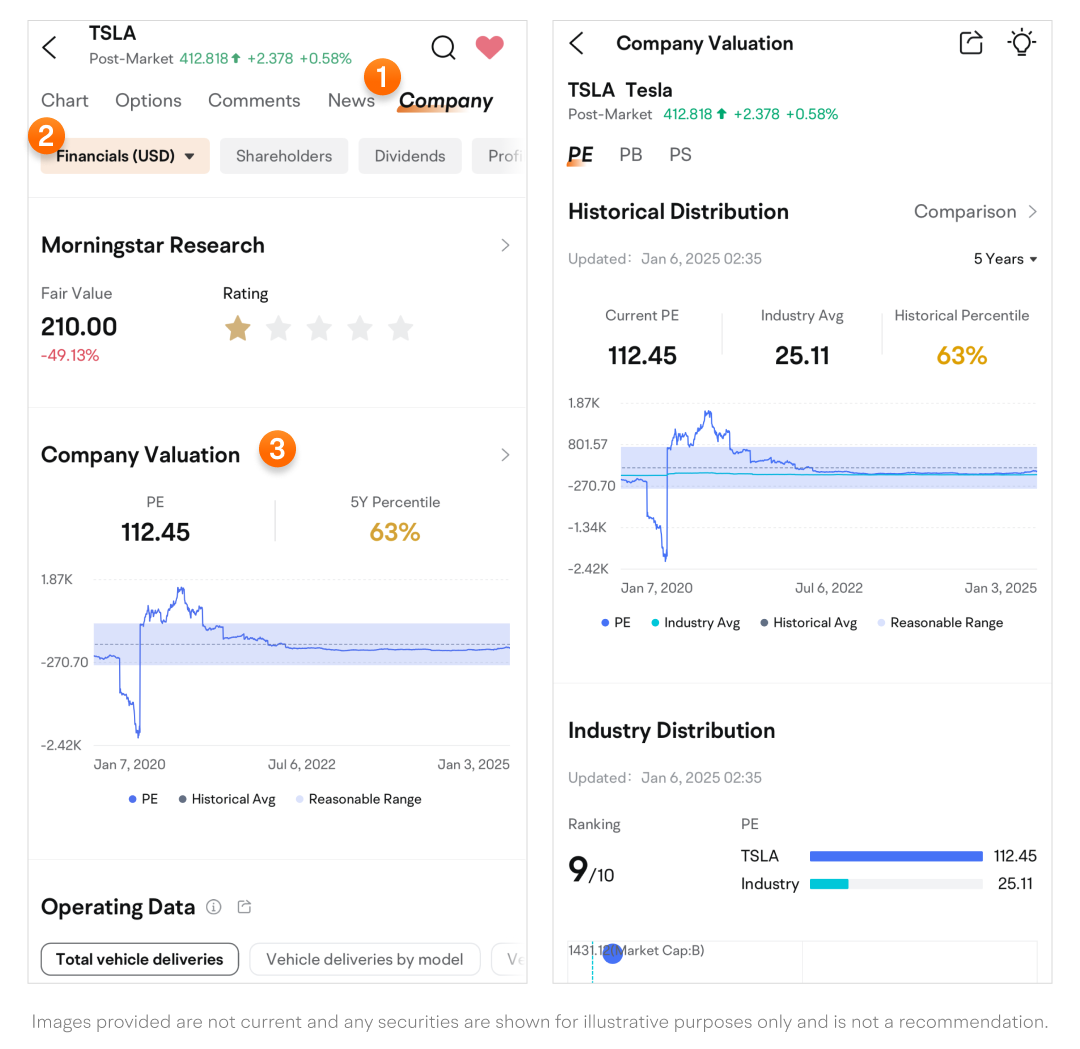
Company Valuation
Valuation methods
-
The details page includes three valuation metrics:
-
PE (Trailing Twelve Months) = Stock Price / Earnings Per Share (EPS) (EPS = Net Profit / Shares Outstanding over the last 12 months)
-
PB = Stock Price / Book Value Per Share (Book Value Per Share = Shareholder Equity / Shares Outstanding)
-
PS = Stock Price / Sales Per Share (Sales Per Share = Total Revenue over the last 12 months / Shares Outstanding)
-
-
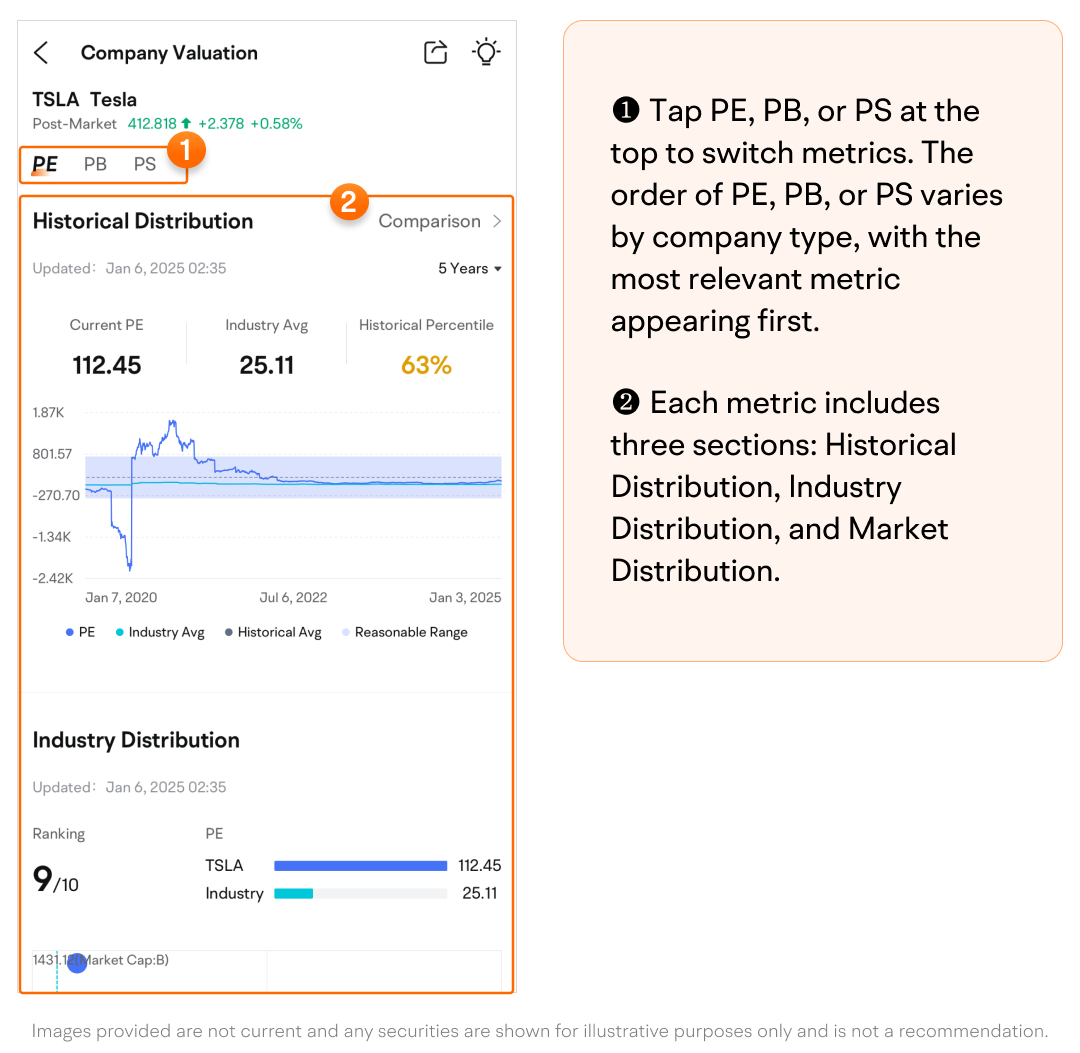
Tap PE, PB, or PS at the top to switch metrics.
-
The order of PE, PB, or PS varies by company type, with the most relevant metric appearing first.
-
Each metric includes three sections: Historical Distribution, Industry Distribution, and Market Distribution.
-
The following illustration uses PE as an example, but the structure is the same for PB and PS.
-
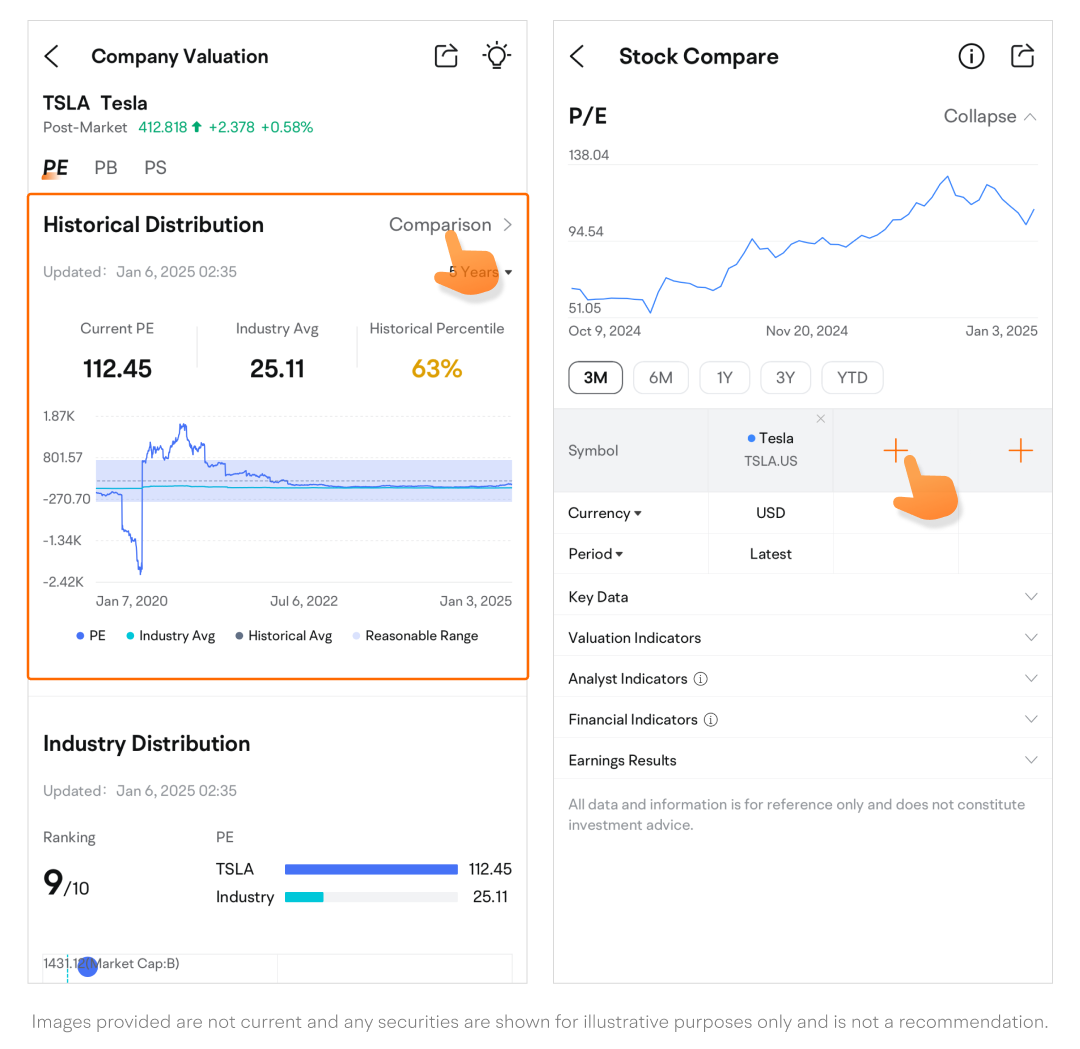
Historical Distribution
-
The Historical Distribution chart shows the company's current PE ratio, industry average, historical mean, and reasonable range for the past three months.
-
Tap Compare > to compare with other stocks.
Industry Distribution
-
This section presents the stock's PE rank in its industry, its PE ratio, and the industry average.
-
The chart displays market capitalization on the vertical axis and PE ratio on the horizontal axis, with dots representing peer companies.
-
Tap a dot to show the company's name, PE ratio, and market cap.
-
Tap Details to access the stock quotes page.
-
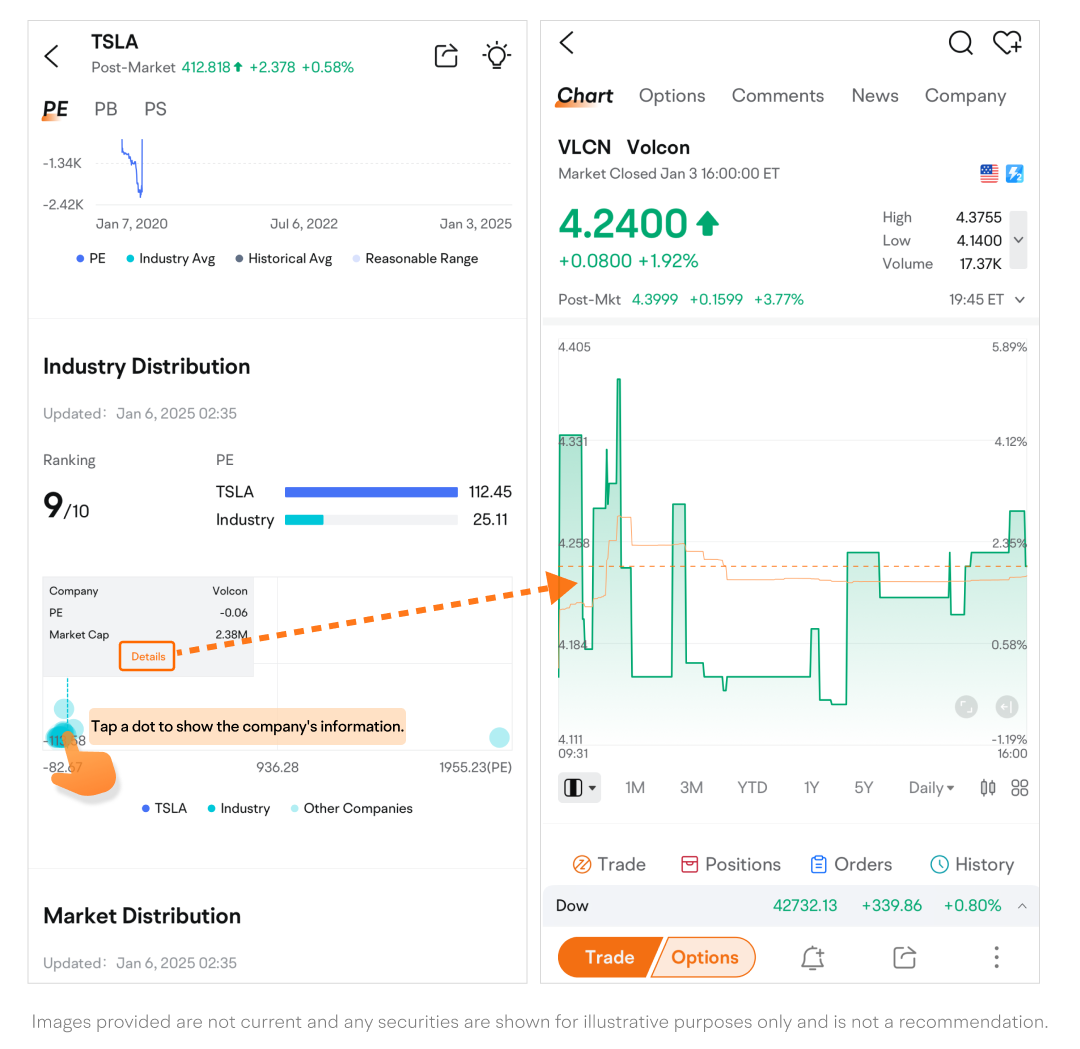
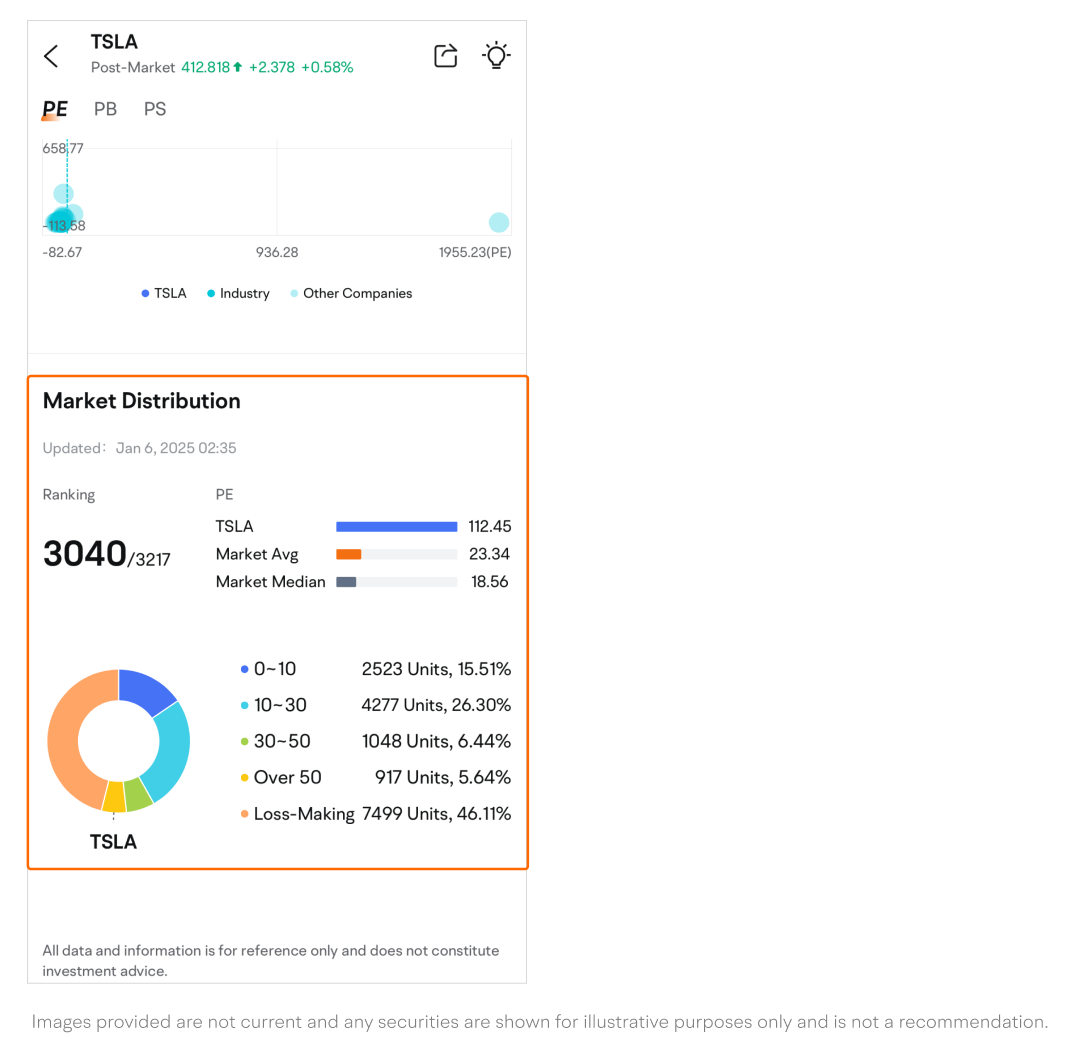
Market Distribution
-
This section displays the stock's PE level across the entire market.
-
The pie chart categorizes PE ranges in the market into groups, showing the percentage each group represents.
This presentation is for informational and educational use only and is not a recommendation or endorsement of any particular investment or investment strategy. Investment information provided in this content is general in nature, strictly for illustrative purposes, and may not be appropriate for all investors. It is provided without respect to individual investors’ financial sophistication, financial situation, investment objectives, investing time horizon, or risk tolerance. You should consider the appropriateness of this information having regard to your relevant personal circumstances before making any investment decisions. Past investment performance does not indicate or guarantee future success. Returns will vary, and all investments carry risks, including loss of principal.
Moomoo is a financial information and trading app offered by Moomoo Technologies Inc. In the U.S., investment products and services on Moomoo are offered by Moomoo Financial Inc., Member FINRA/SIPC.