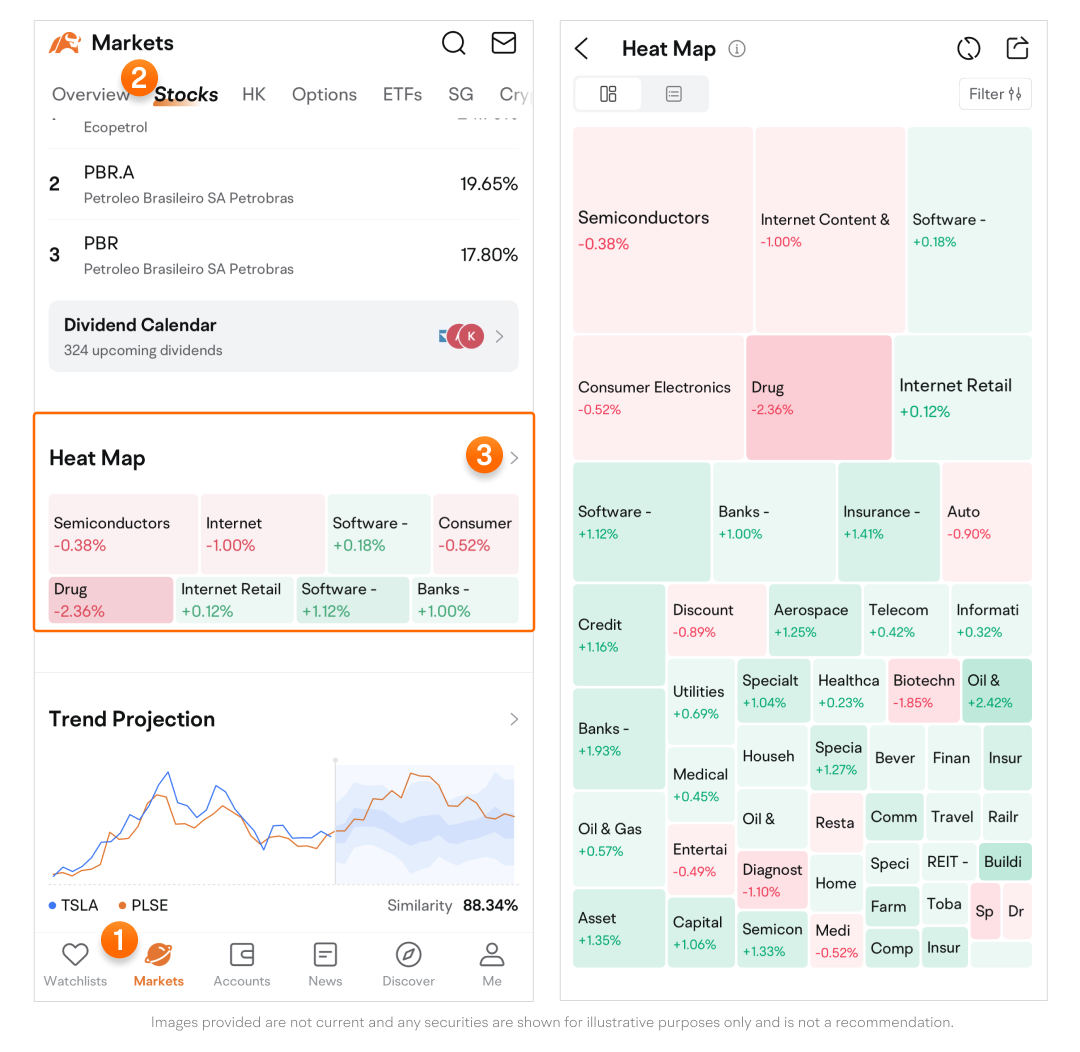
Heat Map
-
Tap the “>” icon to enter the main page.
-
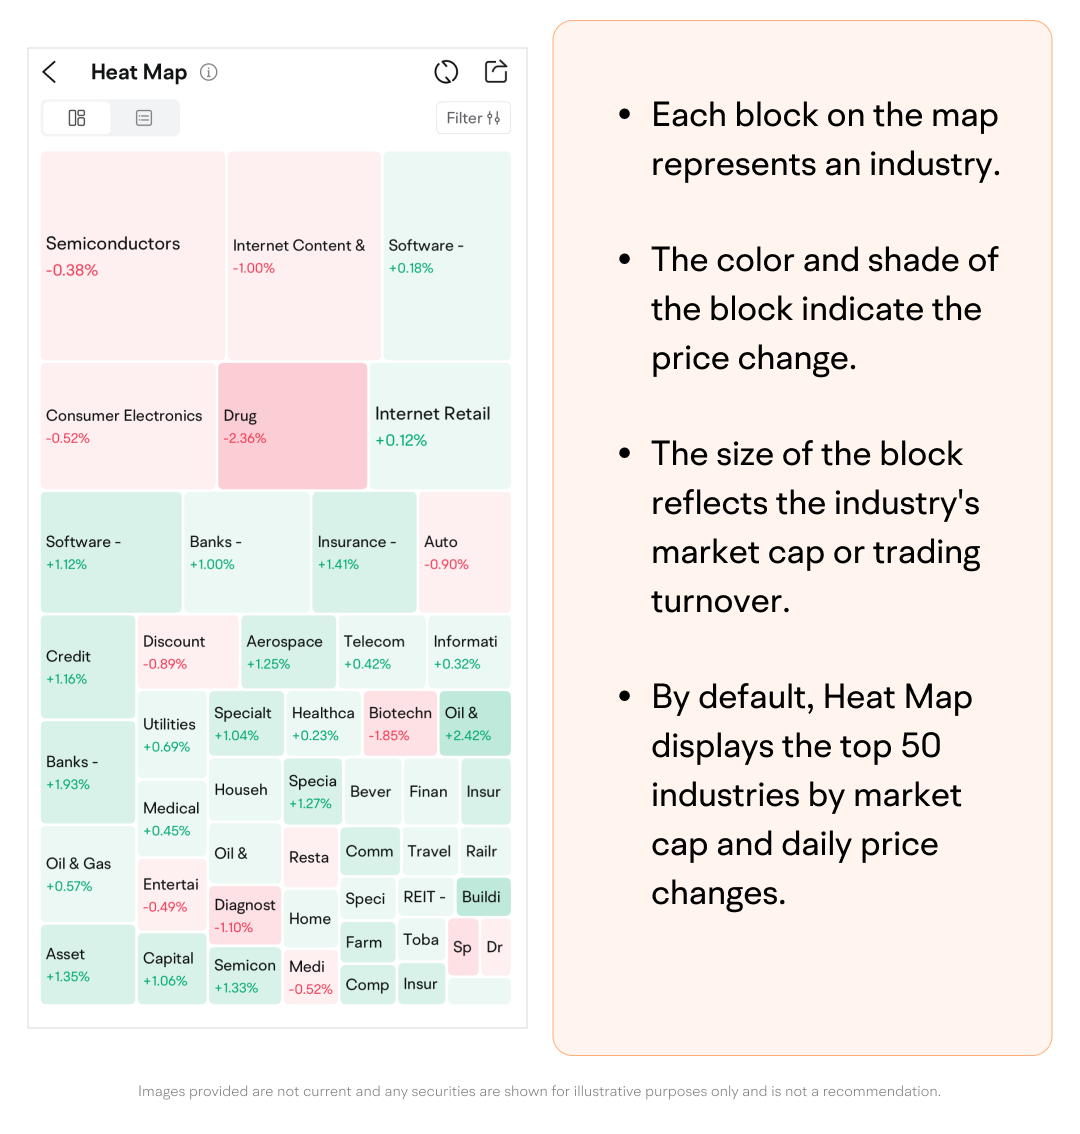
Each block on the map represents an industry.
-
The color and shade of the block indicate the price change.
-
The size of the block reflects the industry's market cap or trading turnover, with larger blocks representing higher values.
-
-
By default, Heat Map displays the top 50 industries by market cap and daily price changes.
-
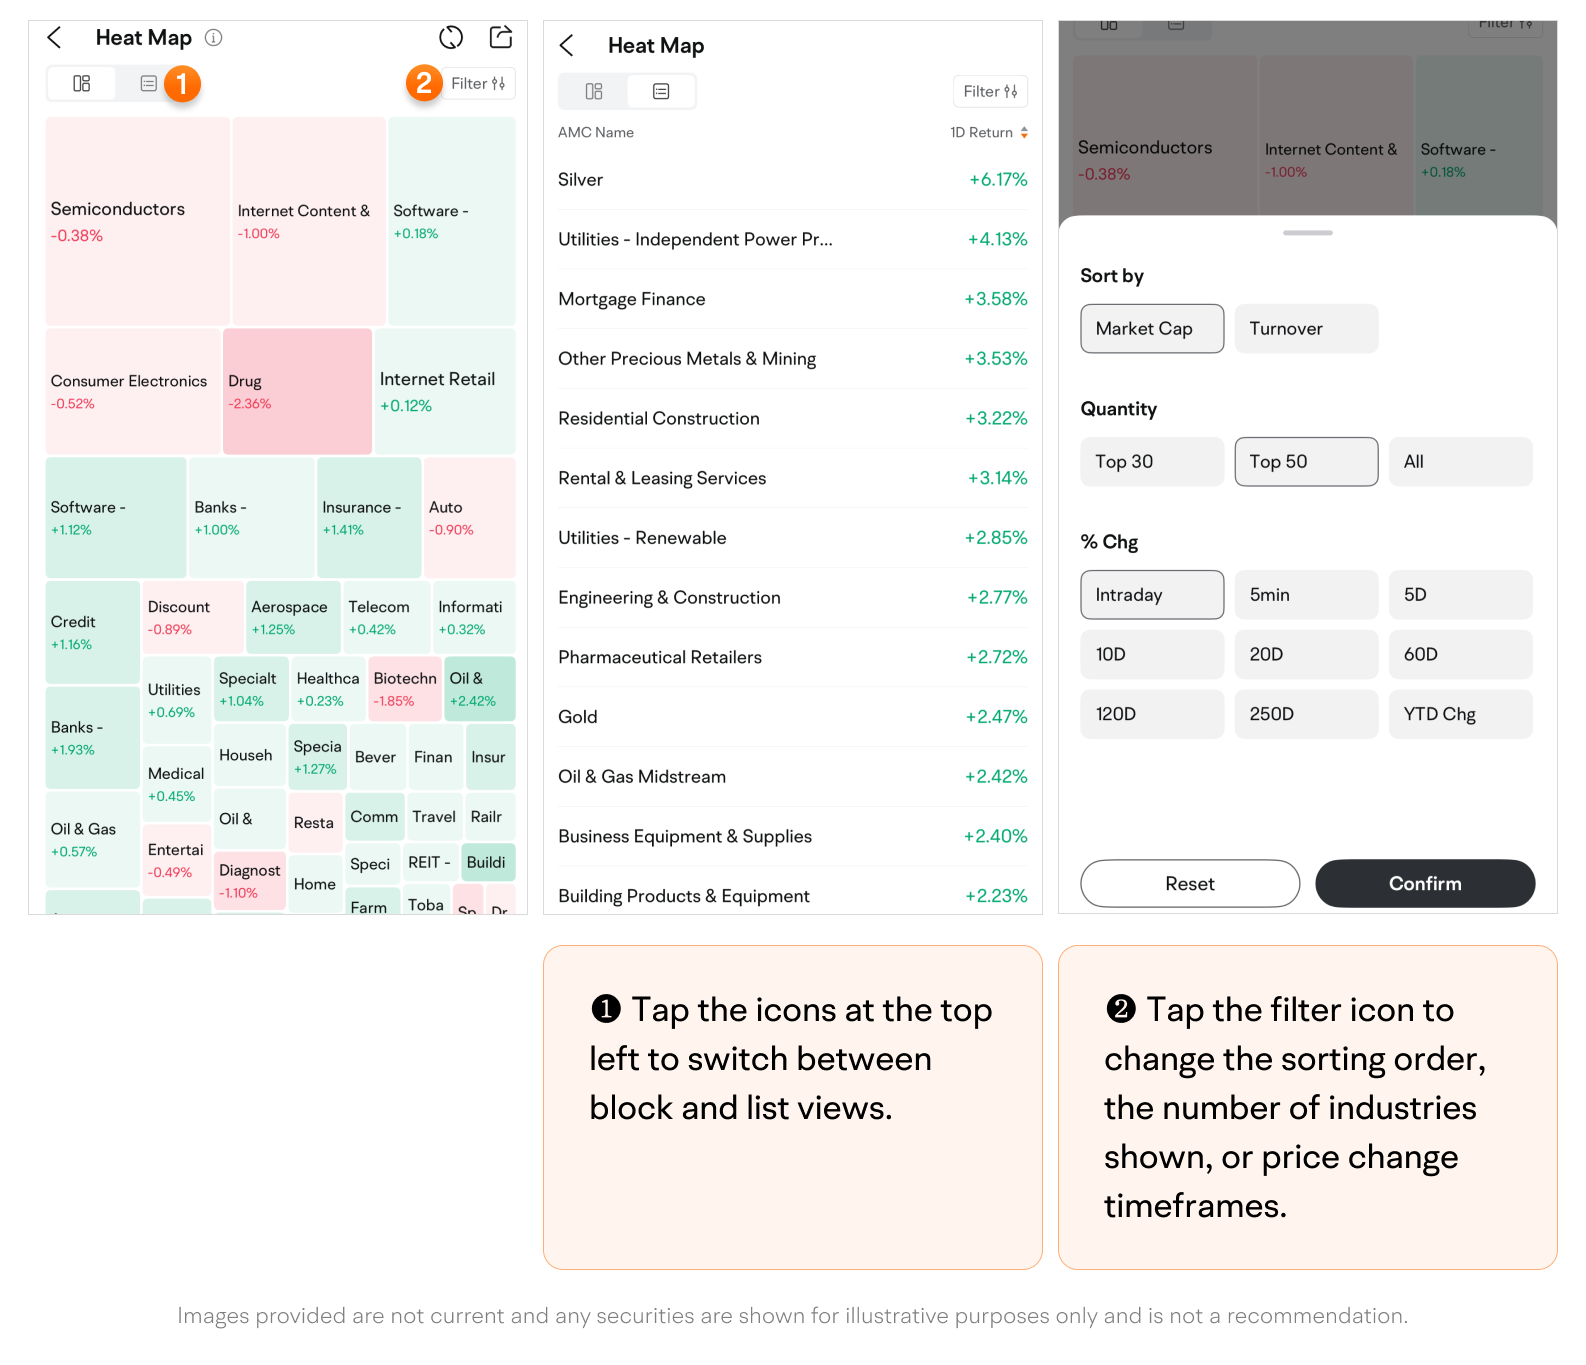
Tap the icons at the top left to switch between block and list views.
-
Tap the filter icon to change the sorting order, the number of industries shown, or price change timeframes.
-
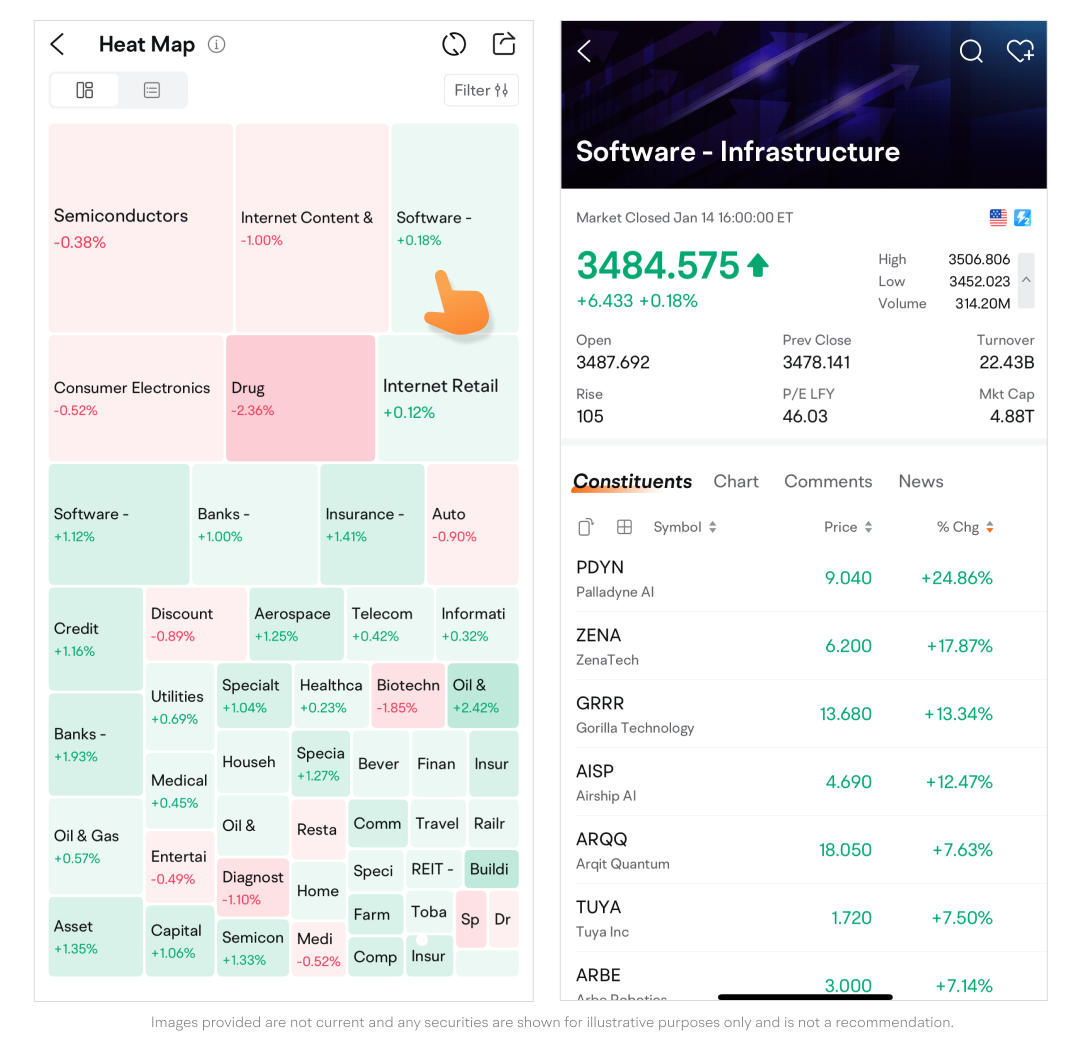
Tap a block on the Heat Map page to access its quotes page, where you can view industry constituents, the price chart, news, and comments.
This presentation is for informational and educational use only and is not a recommendation or endorsement of any particular investment or investment strategy. Investment information provided in this content is general in nature, strictly for illustrative purposes, and may not be appropriate for all investors. It is provided without respect to individual investors’ financial sophistication, financial situation, investment objectives, investing time horizon, or risk tolerance. You should consider the appropriateness of this information having regard to your relevant personal circumstances before making any investment decisions. Past investment performance does not indicate or guarantee future success. Returns will vary, and all investments carry risks, including loss of principal.
Moomoo is a financial information and trading app offered by Moomoo Technologies Inc. In the U.S., investment products and services on Moomoo are offered by Moomoo Financial Inc., Member FINRA/SIPC.